PQSCADA Sapphire Software

PQSCADA Sapphire, offers a single and unified experience across all data sources and with all power quality devices,
providing a full functionality and a faster performance for data exploration, analysis and visualization.

Report Customisation
Report Customization
Hystorical Data Investigation
Data Investigation
Advanced PQ Analysis
Alarm & Control
Alarm & Control
Multi-vendor Support
Multi-Vendor Support
Real Time Overview
Real Time Overview

Single Interface Any Device

PQSCADA Sapphire is an open, fully programmable platform designed for customization, and ease of integration. With an open and flexible platform, PQSCADA Sapphire supports many levels of customization: from simple end user configurations to XAML styling and full coding.

Data Visualisations

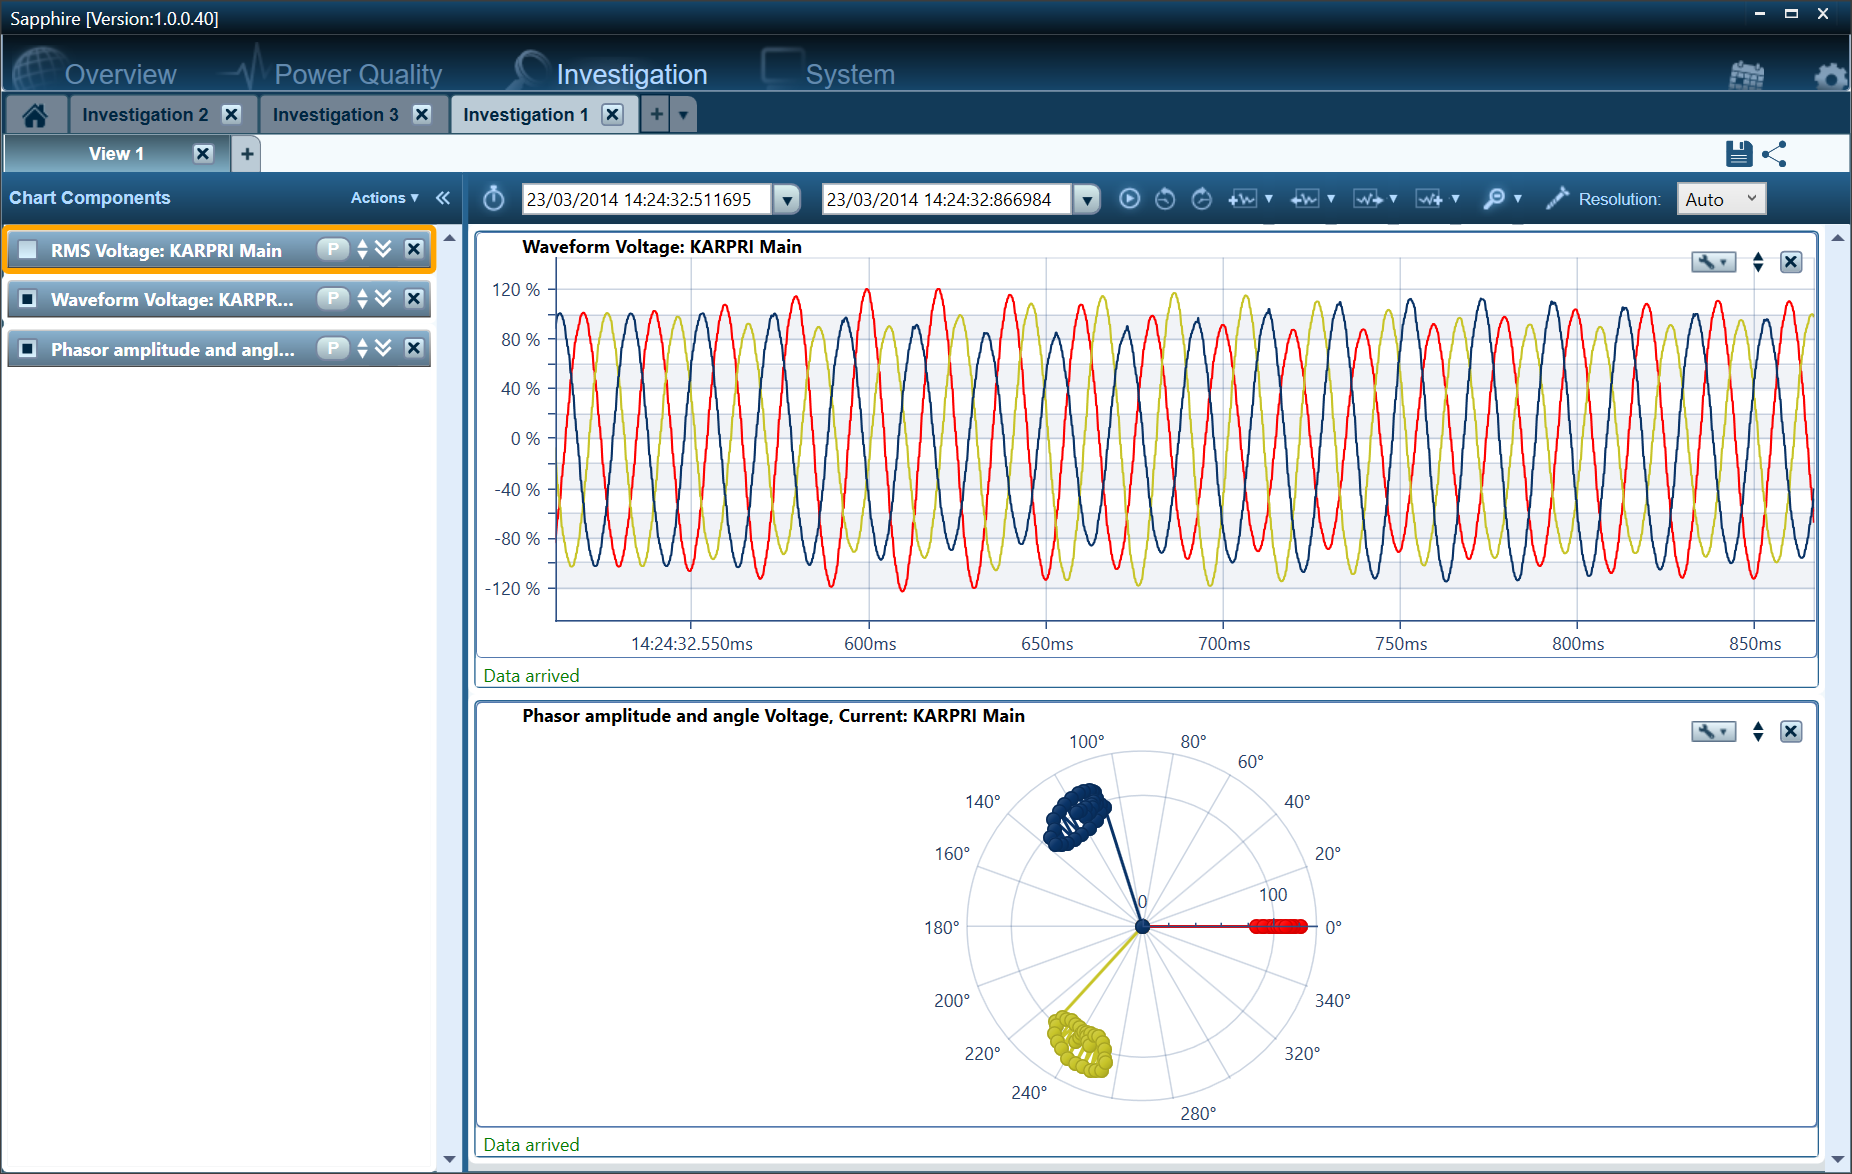
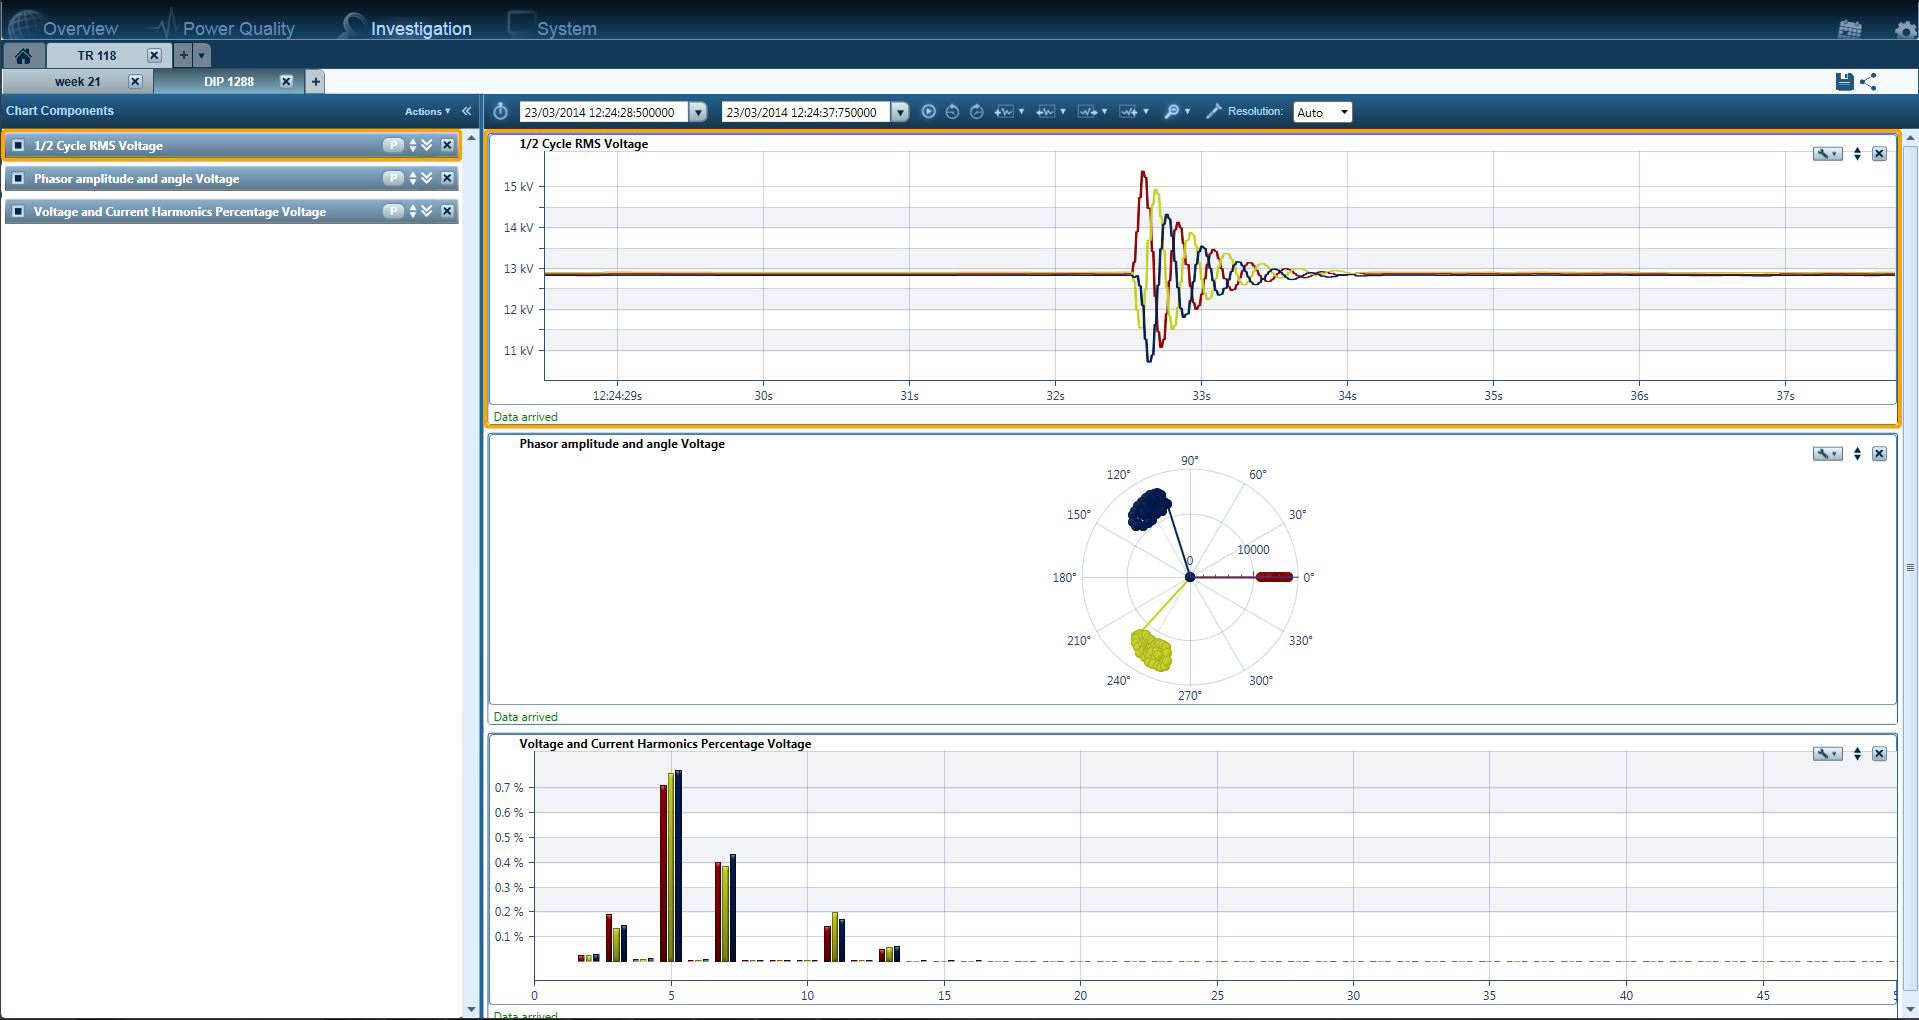
The PQSCADA Sapphire Power Quality’s investigation module offers numerous chart types to choose from such as column/bar, stacked column/bar, multi-level pie, line, curved line, scatter plot and curved area.

To browse charts click here.

Mobile Application

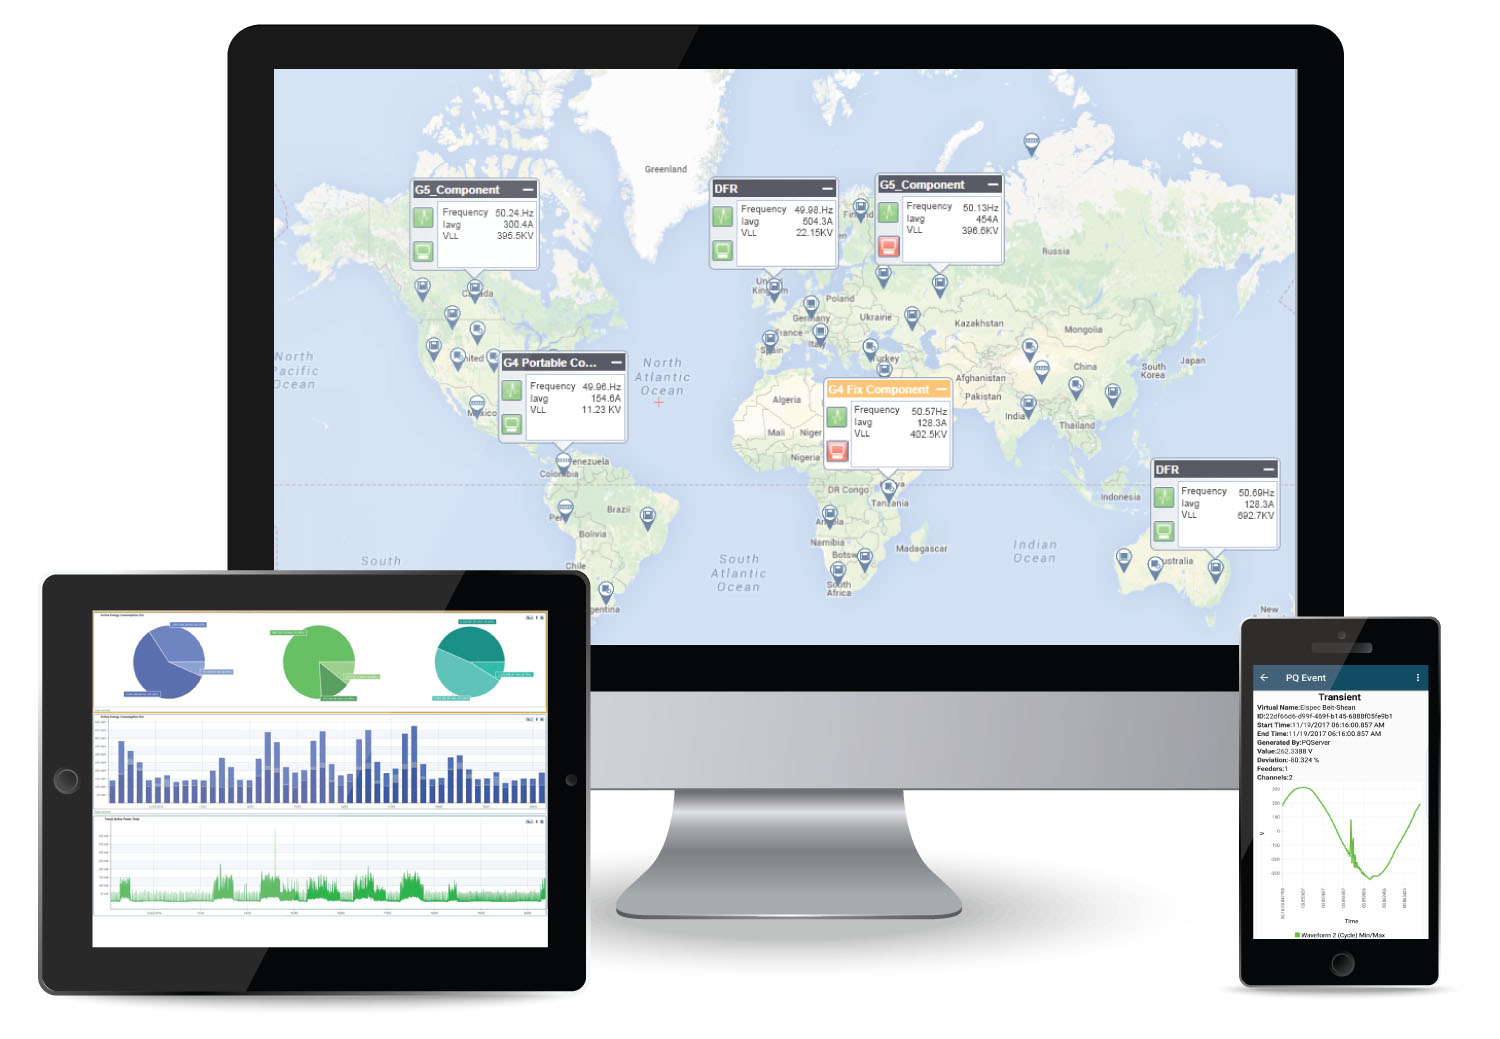
Connect your smart phone to PQSCADA Sapphire server to view real-time data, event notification and system alerts. you may also connect the app directly to any BlackBox device for configuration and installation verification.

View the app by clicking here.

Real Time Overview

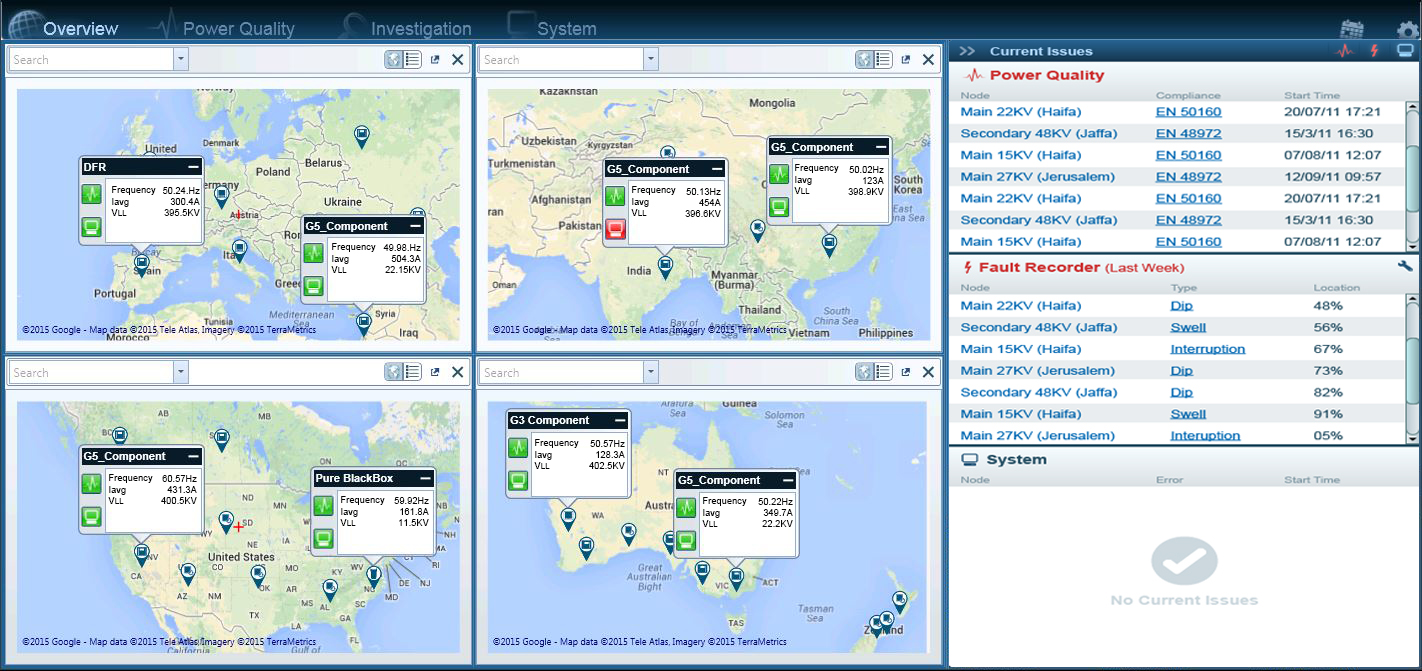
View all measurement points on a live geographical map with real time data and general statuses. In addition to the live map, 3 widgets are available to display the status of the electrical network:

  • Power quality: the power quality widget displays a list of measurement points that are in violation of pre-configured grid code. A link to the map or the investigation is available for quick access.
  • Disturbances: the disturbances widget displays a list of short predefined events that occurred during the last hour/day/week/month. A link to the map or the investigation is available for quick access.
  • System: the system widget displays a list of system messages/warnings about the operation’s condition. A link to the system module for further investigation is available as well.

Power Quality Analysis

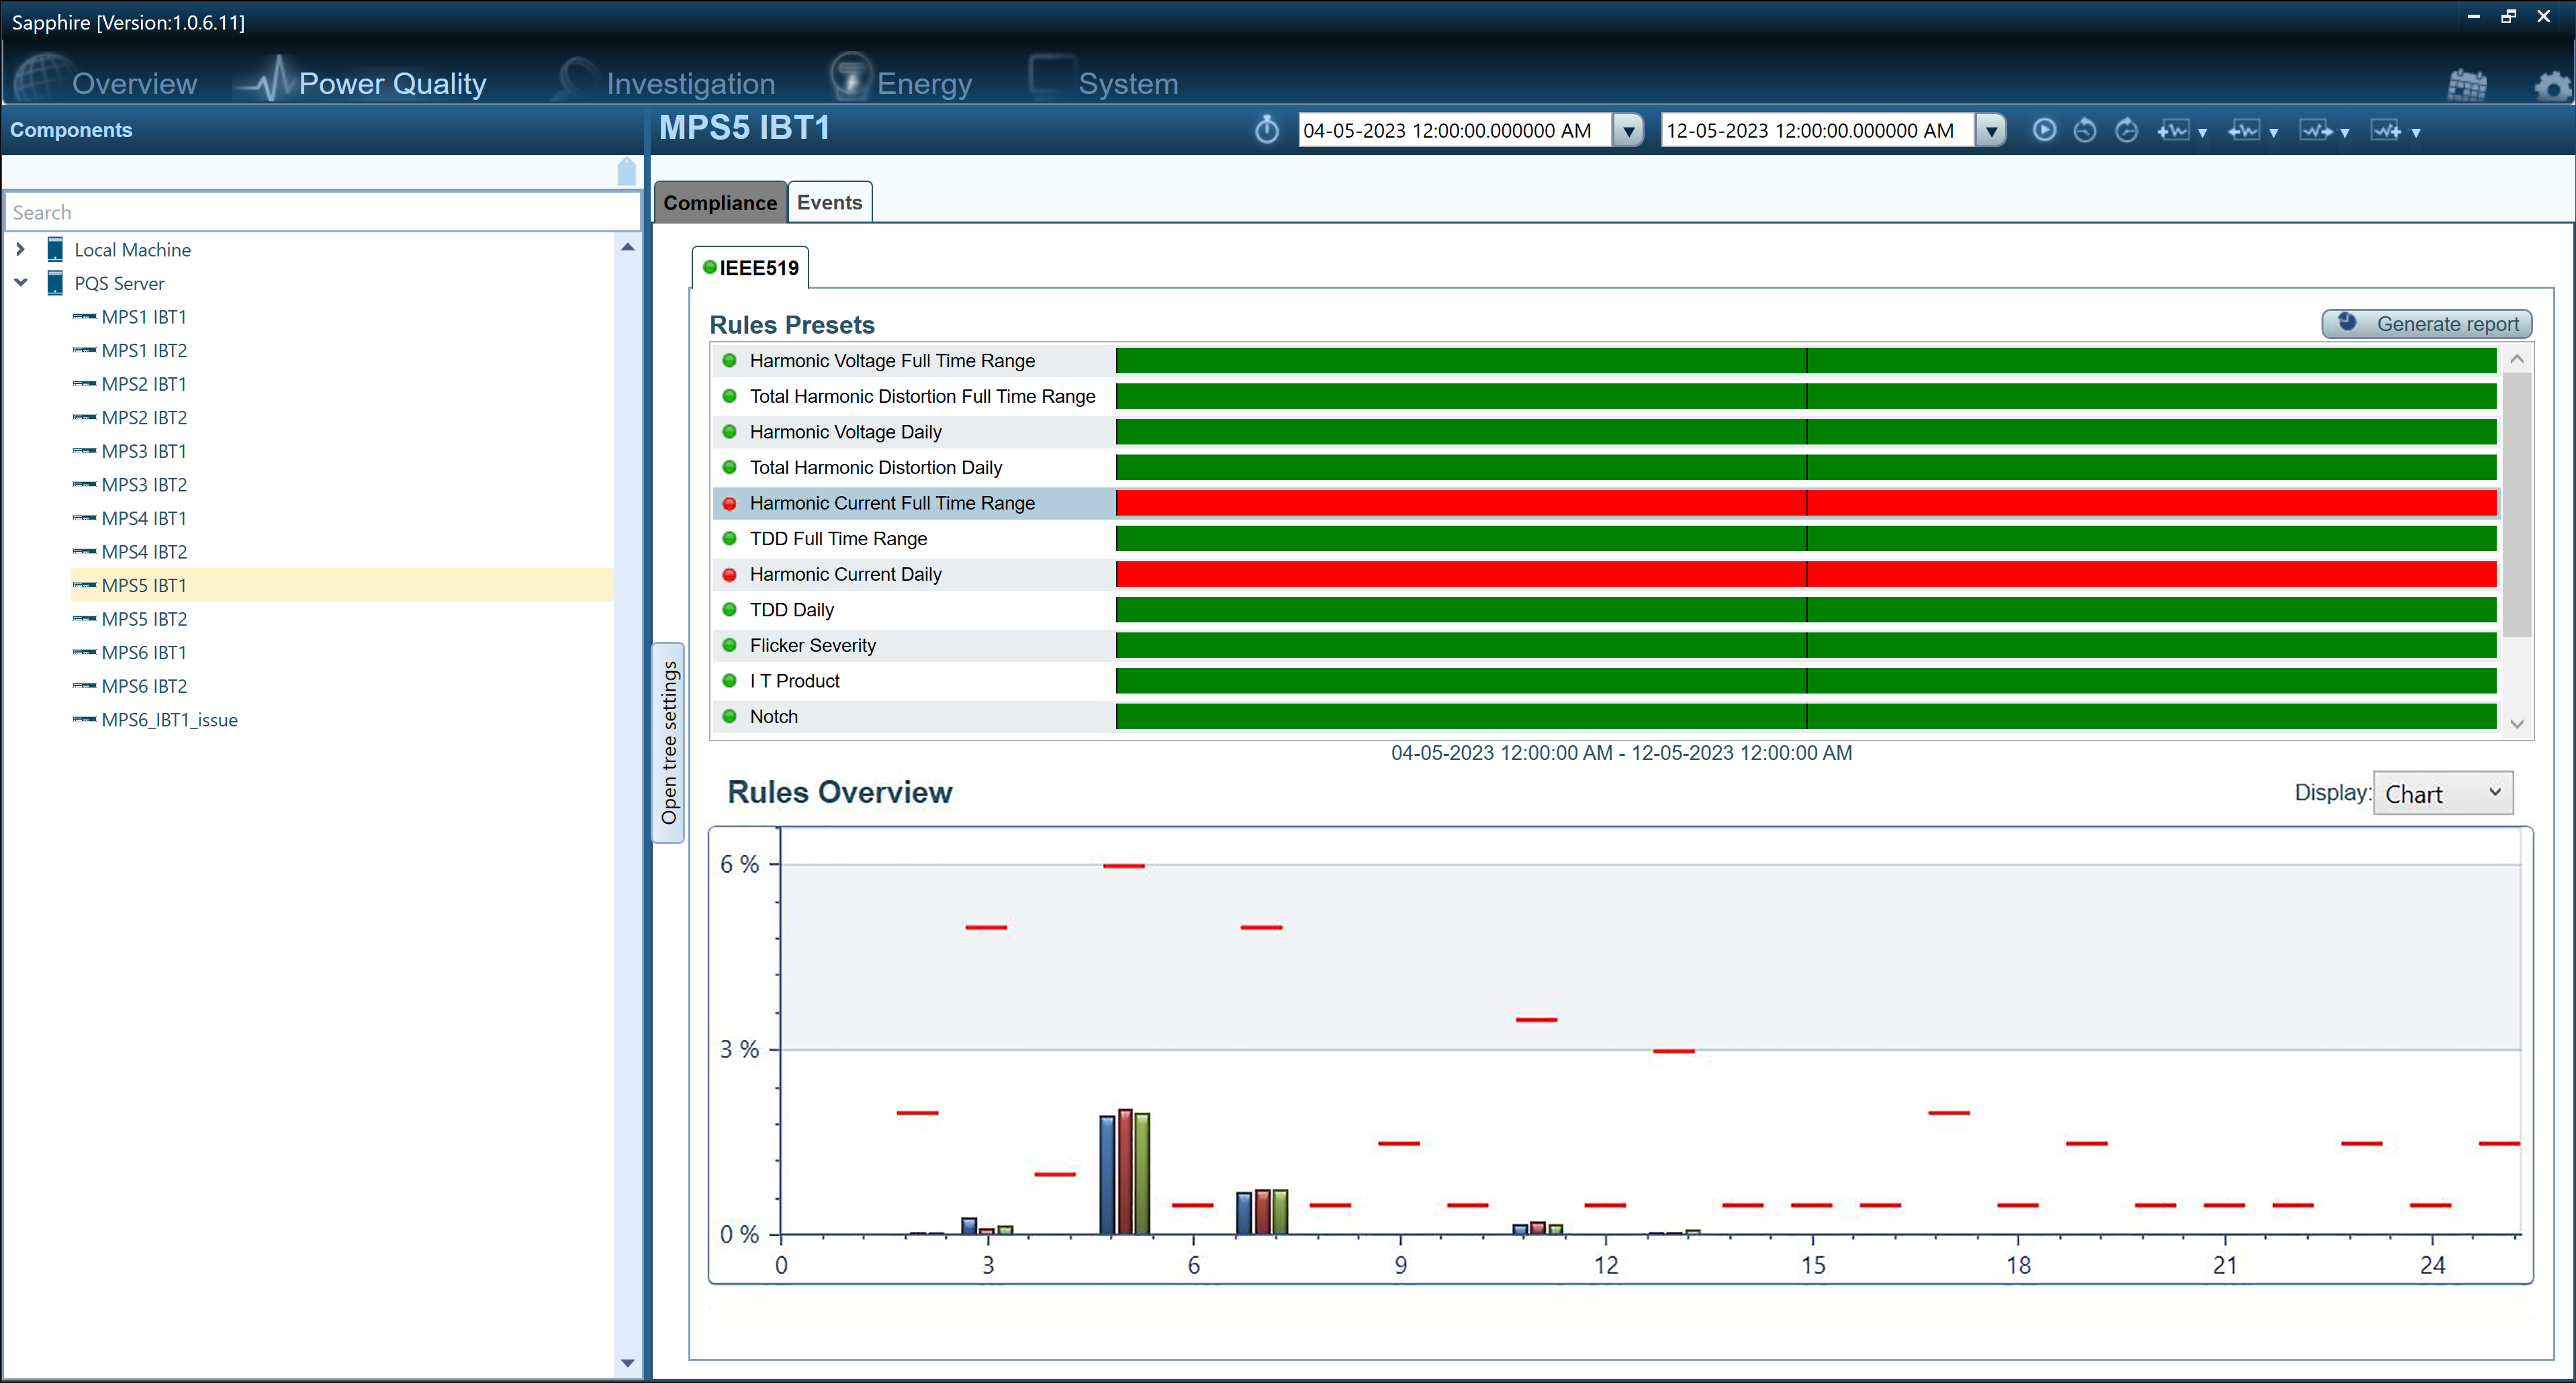
The power Quality module shows at a glance the status of the entire network or individual measurement points for a selected period of time. The power quality conditions are configurable and can meet any grid code. Multiple compliance conditions can apply to a single measurement point for comparison. A comprehensive report, based on the power quality compliance conditions, can be easily generated from the power quality module.

Power Quality Software

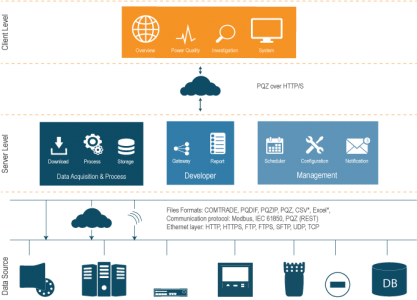
PQSCADA Sapphire is a multi-component, vendor free, PQ software. PQSCADA Sapphire integrates data from protection relays, fault recorders, power quality analyzers, smart meters and other data sources into a single data base.

PQSCADA Sapphire reads data from a variety of sources, data formats supported include:

  • COMTRADE: IEEE Std C37.111-1991 | IEEE C37.111-1999
  • PQDIF: Power Quality Data Interchange Format – IEEE Std 1159.3-2002
  • Elspec PQZIP – Continuous waveform recording
  • Elspec PQZ – Continuous waveform recording
  • IEC 61850 MMS
  • MODBUS TCP

PQSCADA SAPPHIRE SELECTION TABLE

Express

$Free
  • Import/Export PQZIP
  • Import/Export PQZ
  • Import/Export COMTRADE
  • Import/Export PQDIF
  • Export to Excel
  • Export to CSV
  • up-to 2 sites per investigation
  • Trend chart
  • Grid chart
  • Summary chart
  • Spectrum chart
  • Statistics chart
  • Event chart
  • Scatter events chart

Professional

$2400
  • Import/Export PQZIP
  • Import/Export PQZ
  • Import/Export COMTRADE
  • Import/Export PQDIF
  • Export to Excel
  • Export to CSV
  • MODBUS TCP/IP
  • IEC 61850
  • Unlimited
  • Trend chart
  • Grid chart
  • Summary chart
  • Spectrum chart
  • Statistics chart
  • Event chart
  • Scatter events chart
  • Scatter parameter chart
  • Cyclic histogram chart
  • Phasors chart
  • Overview module
  • Tags

Enterprise

$6400
  • Import/Export PQZIP
  • Import/Export PQZ
  • Import/Export COMTRADE
  • Import/Export PQDIF
  • Export to Excel
  • Export to CSV
  • MODBUS TCP/IP
  • IEC 61850
  • Unlimited
  • Trend chart
  • Grid chart
  • Summary chart
  • Spectrum chart
  • Statistics chart
  • Event chart
  • Scatter events chart
  • Scatter parameter chart
  • Cyclic histogram chart
  • Phasors chart
  • Schedule tasks
  • Triggered tasks
  • enhanced security module
  • Run as system service
  • Client/server architecture
  • Servers hierarchy
  • Overview module
  • Tags
  • Email notifications
  • SMS notifications
  • Push events to Sapphire App