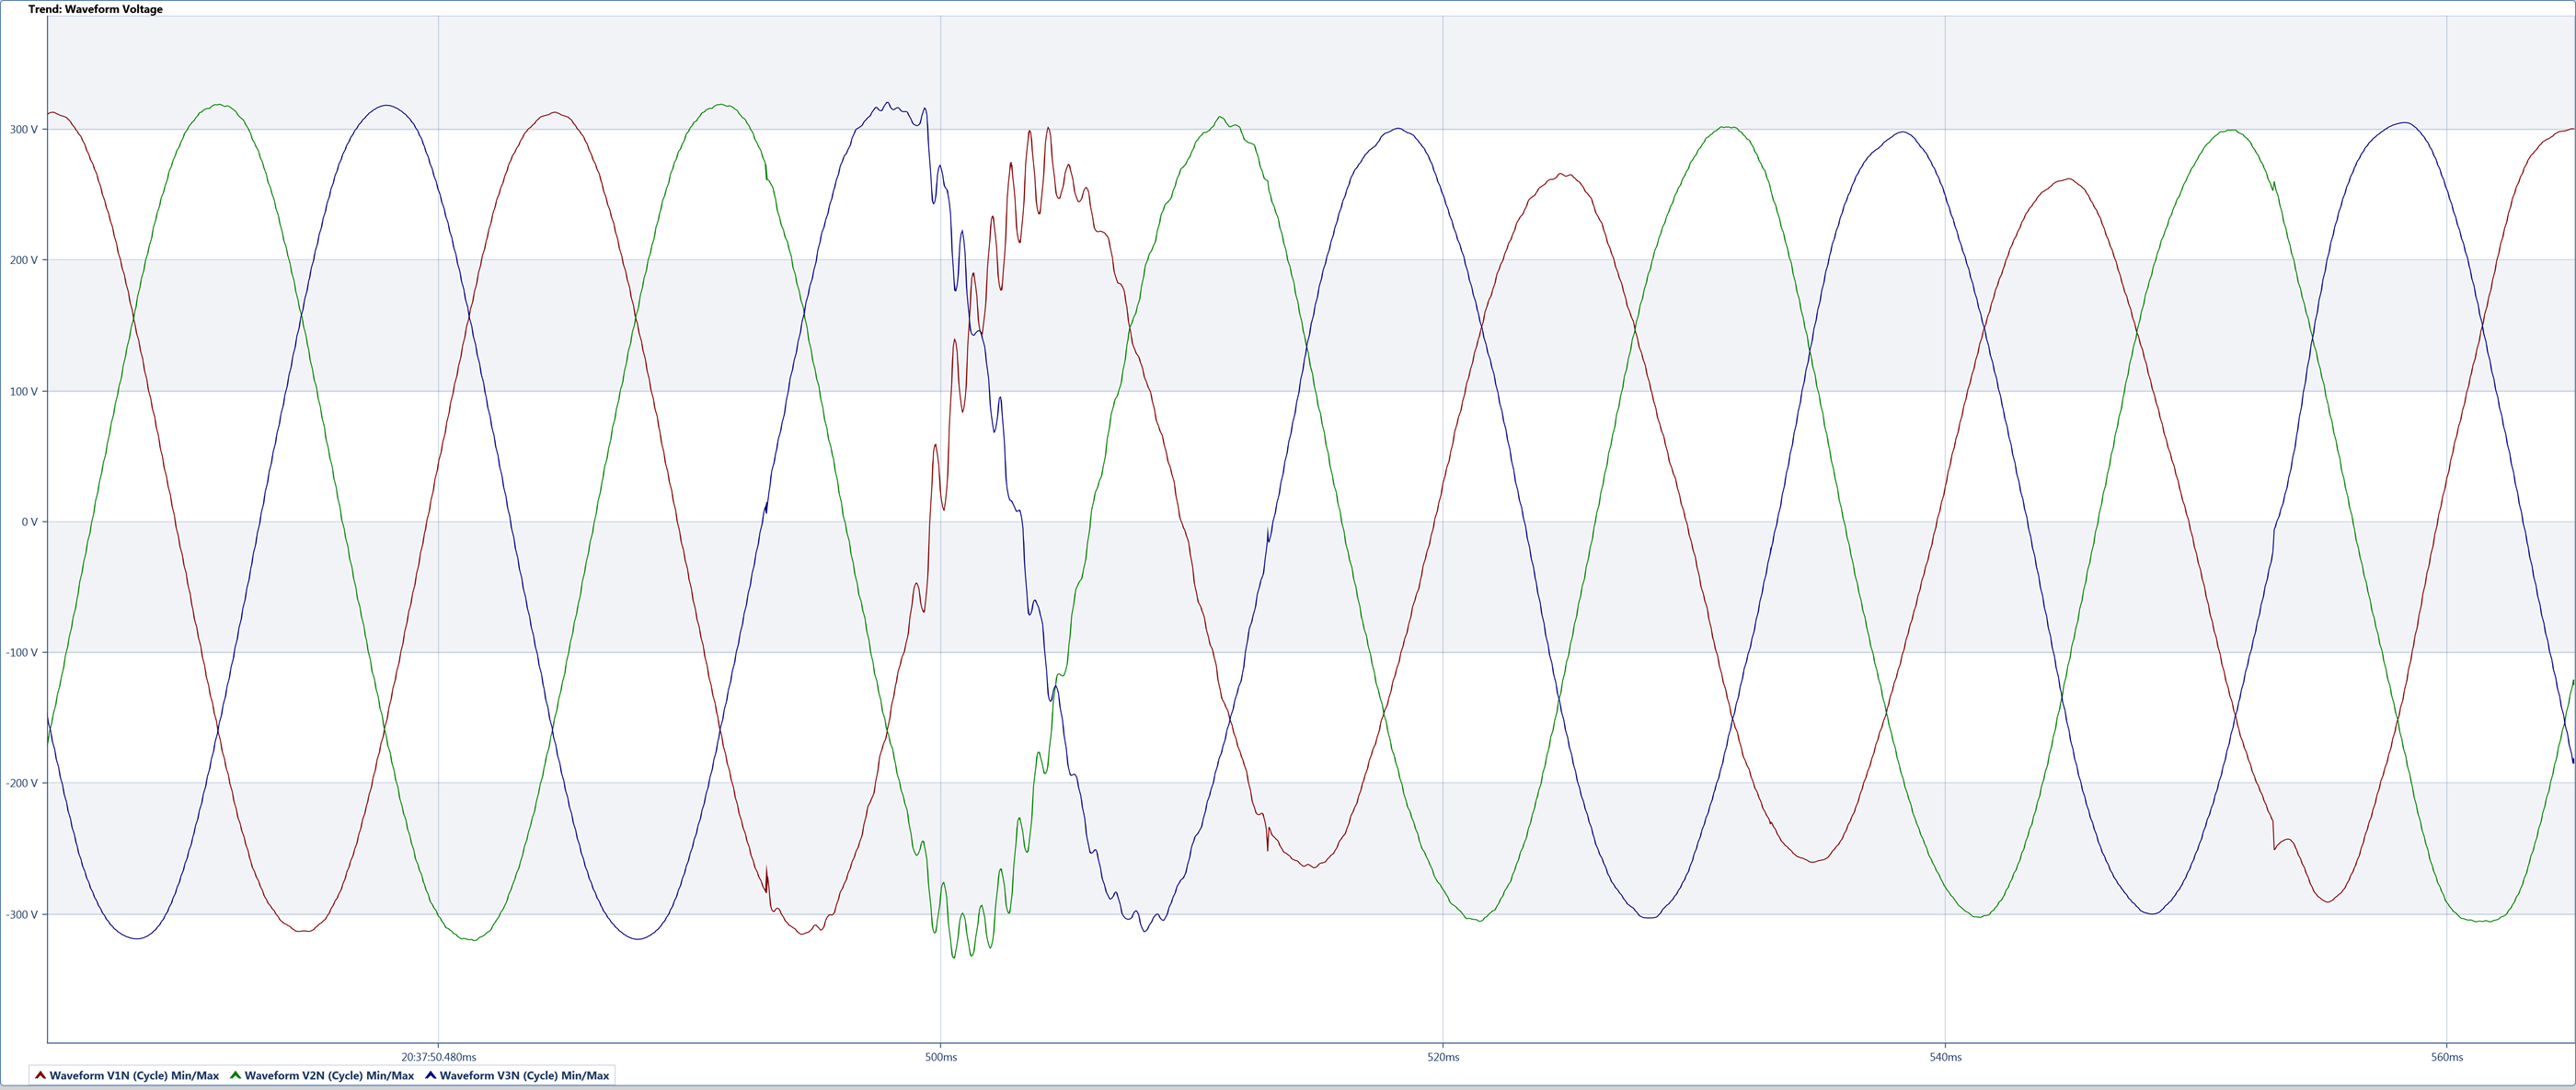
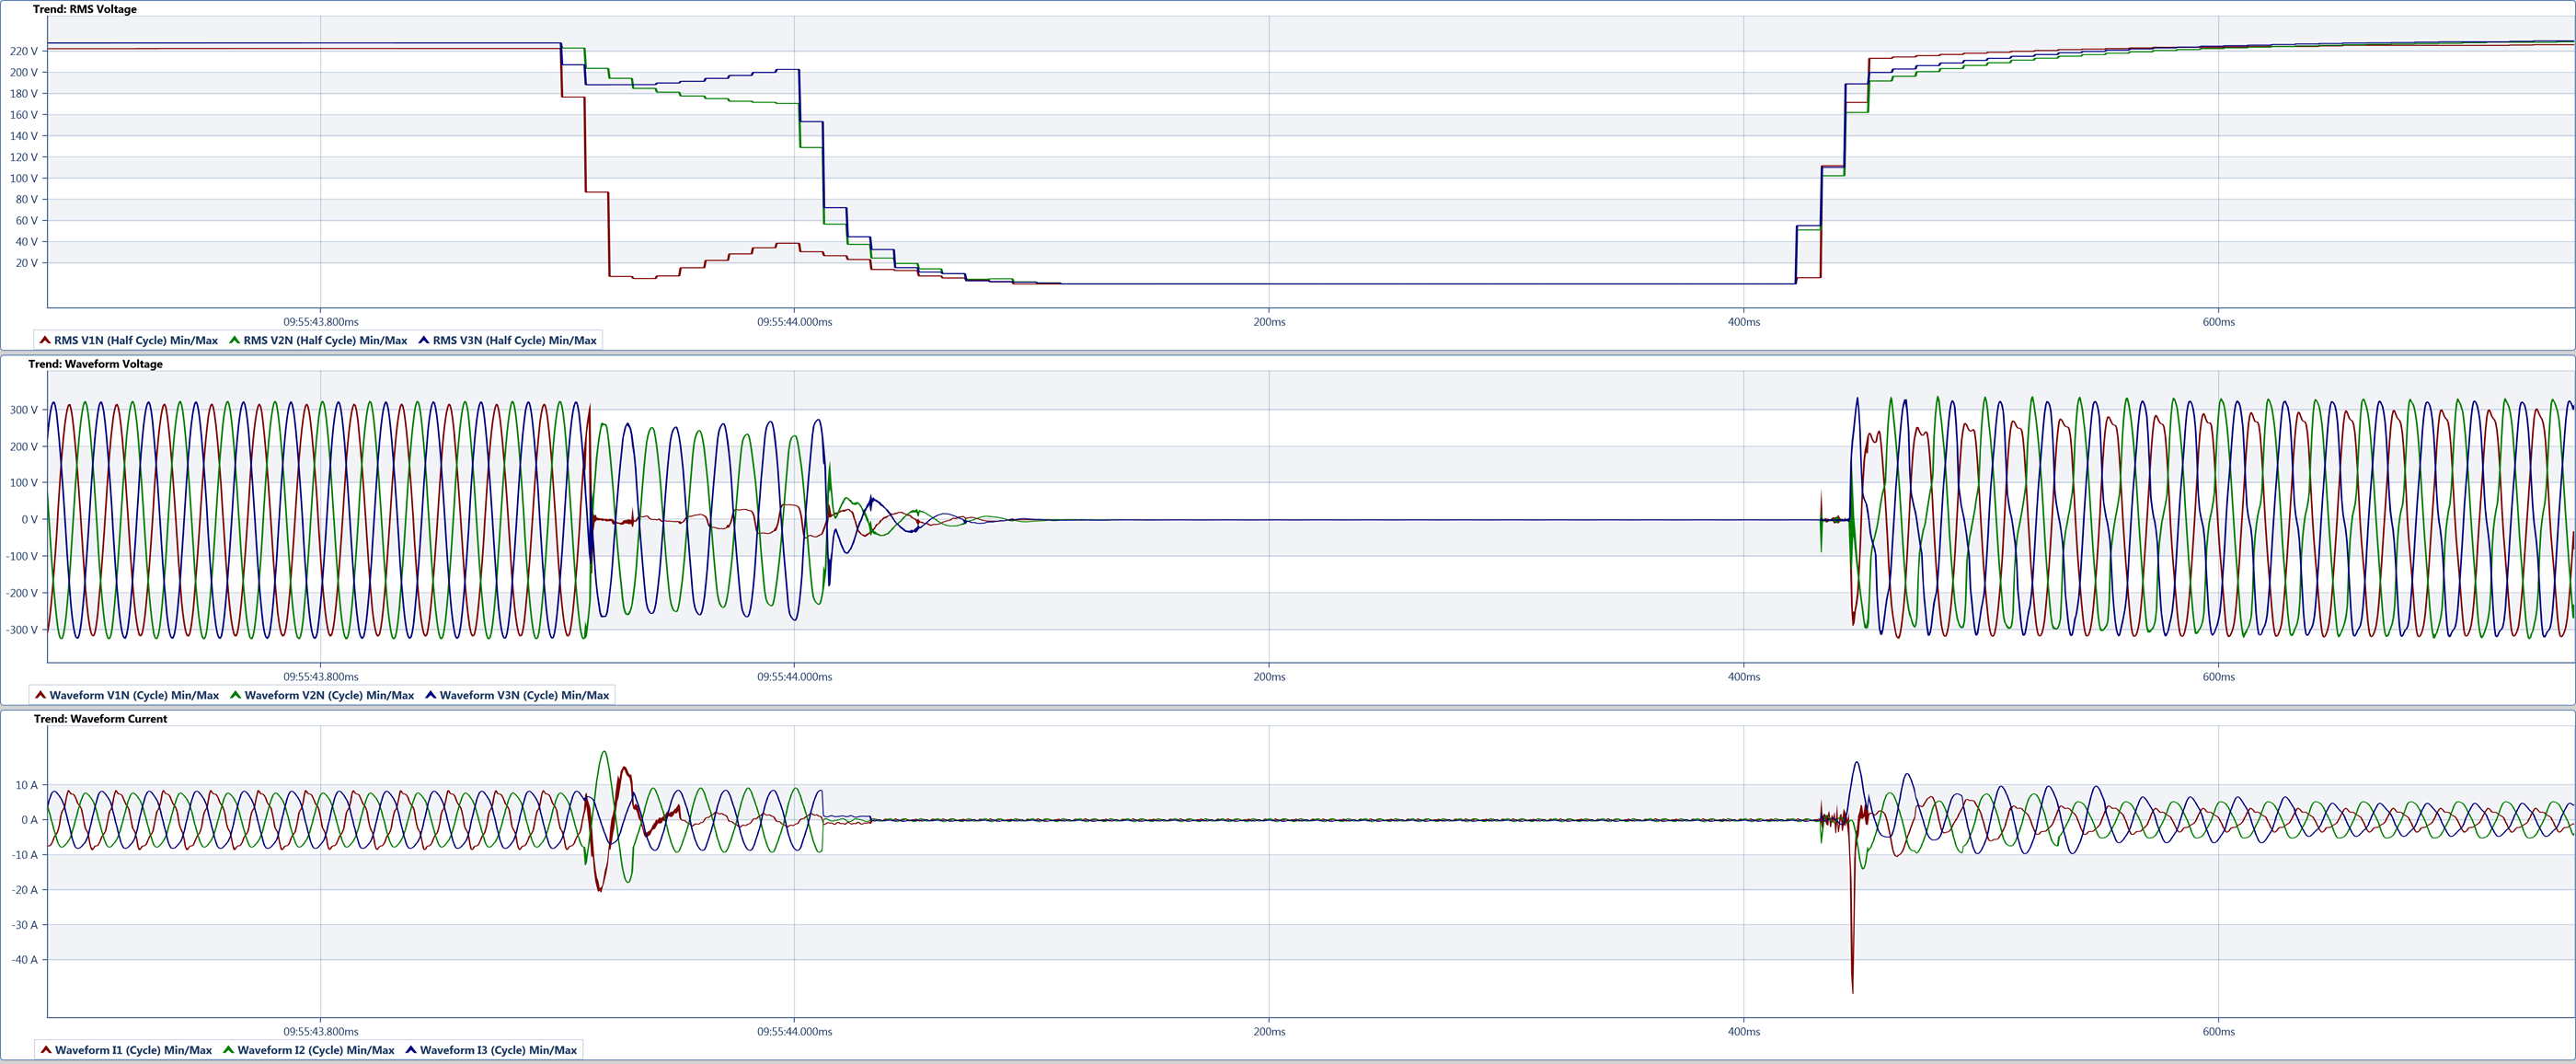
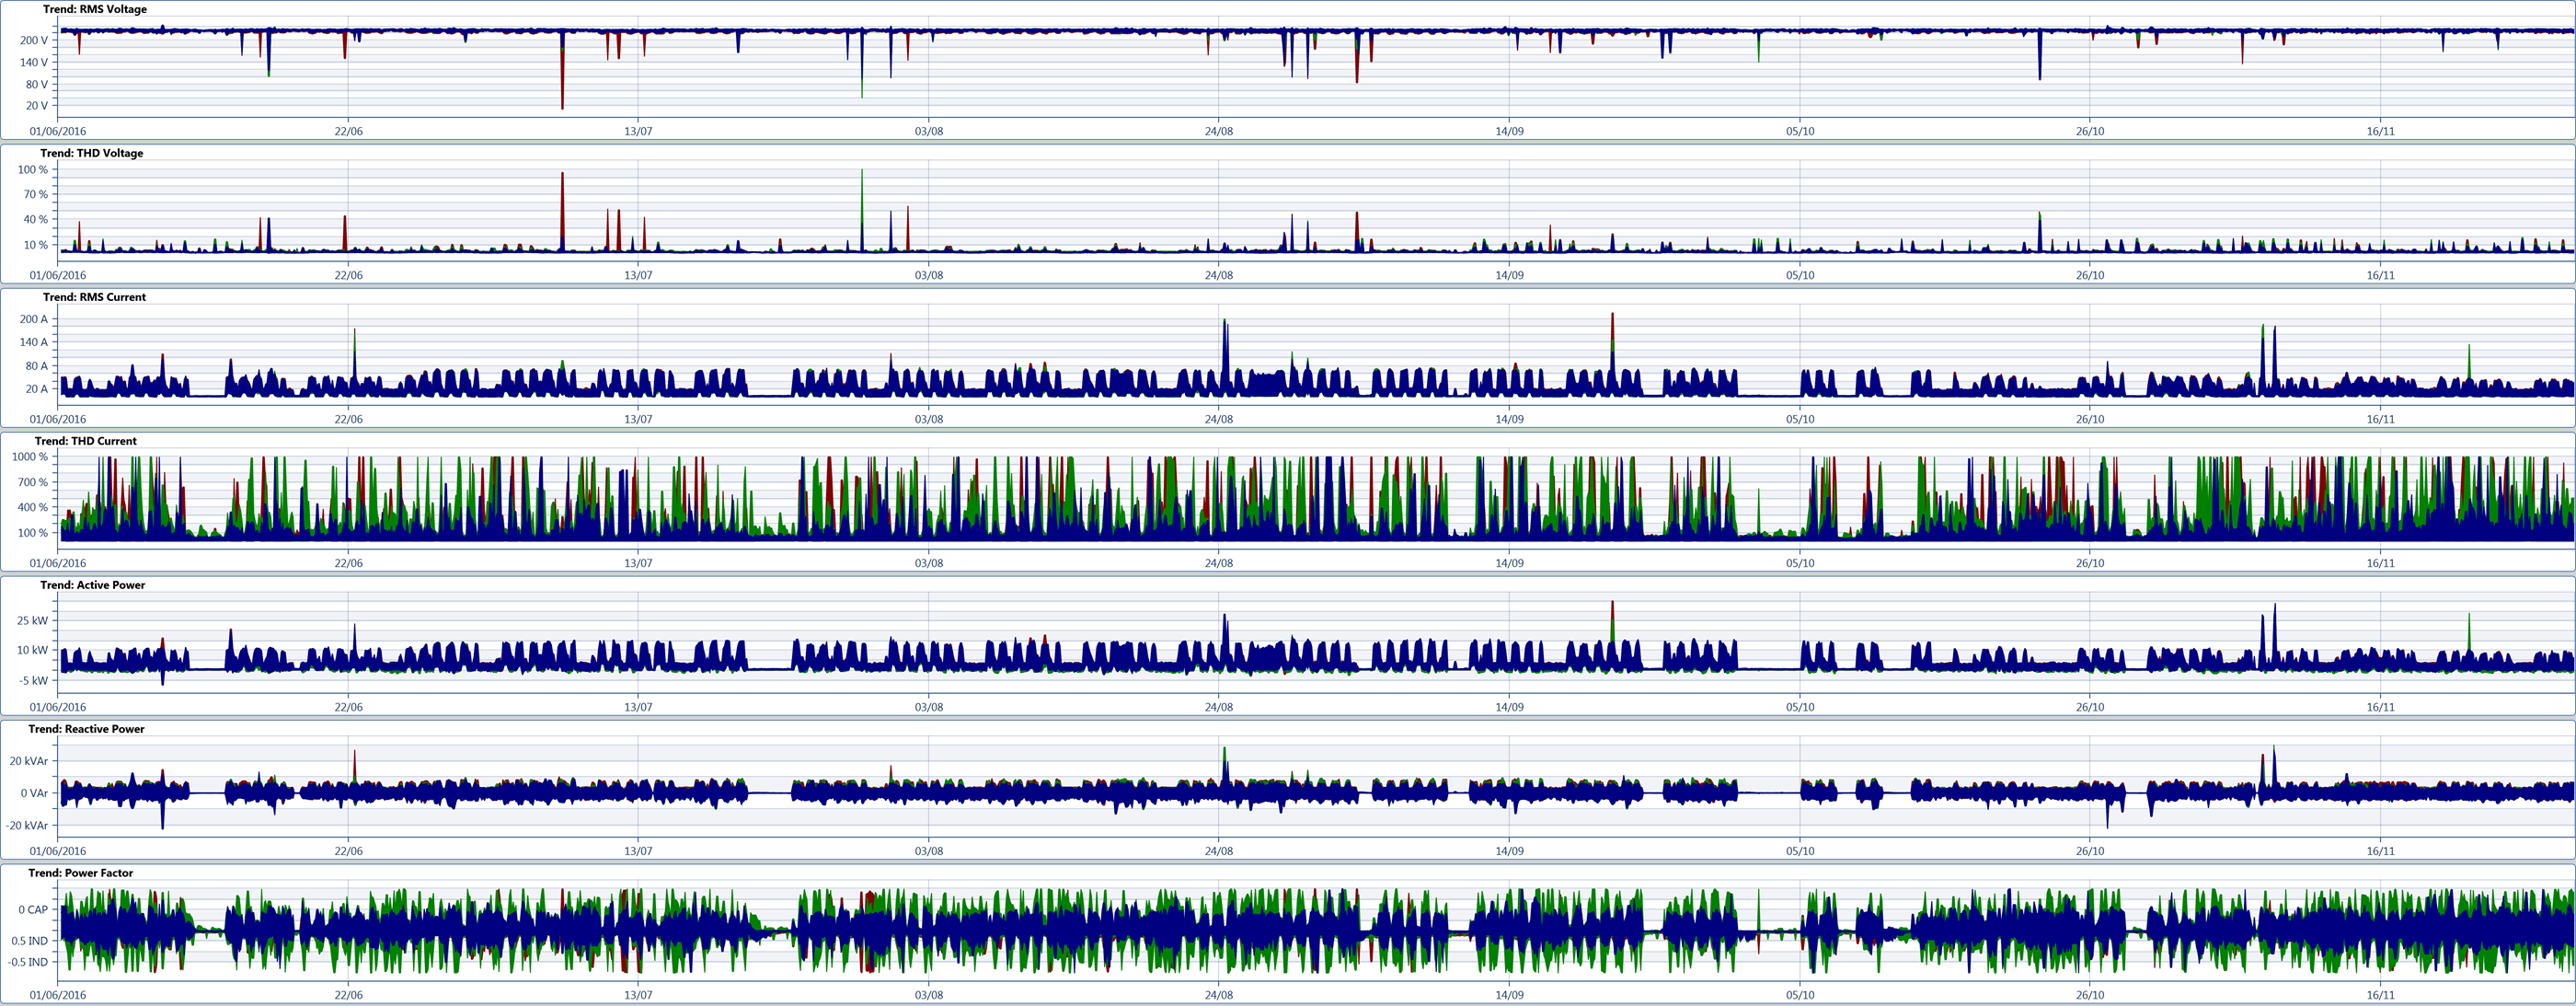
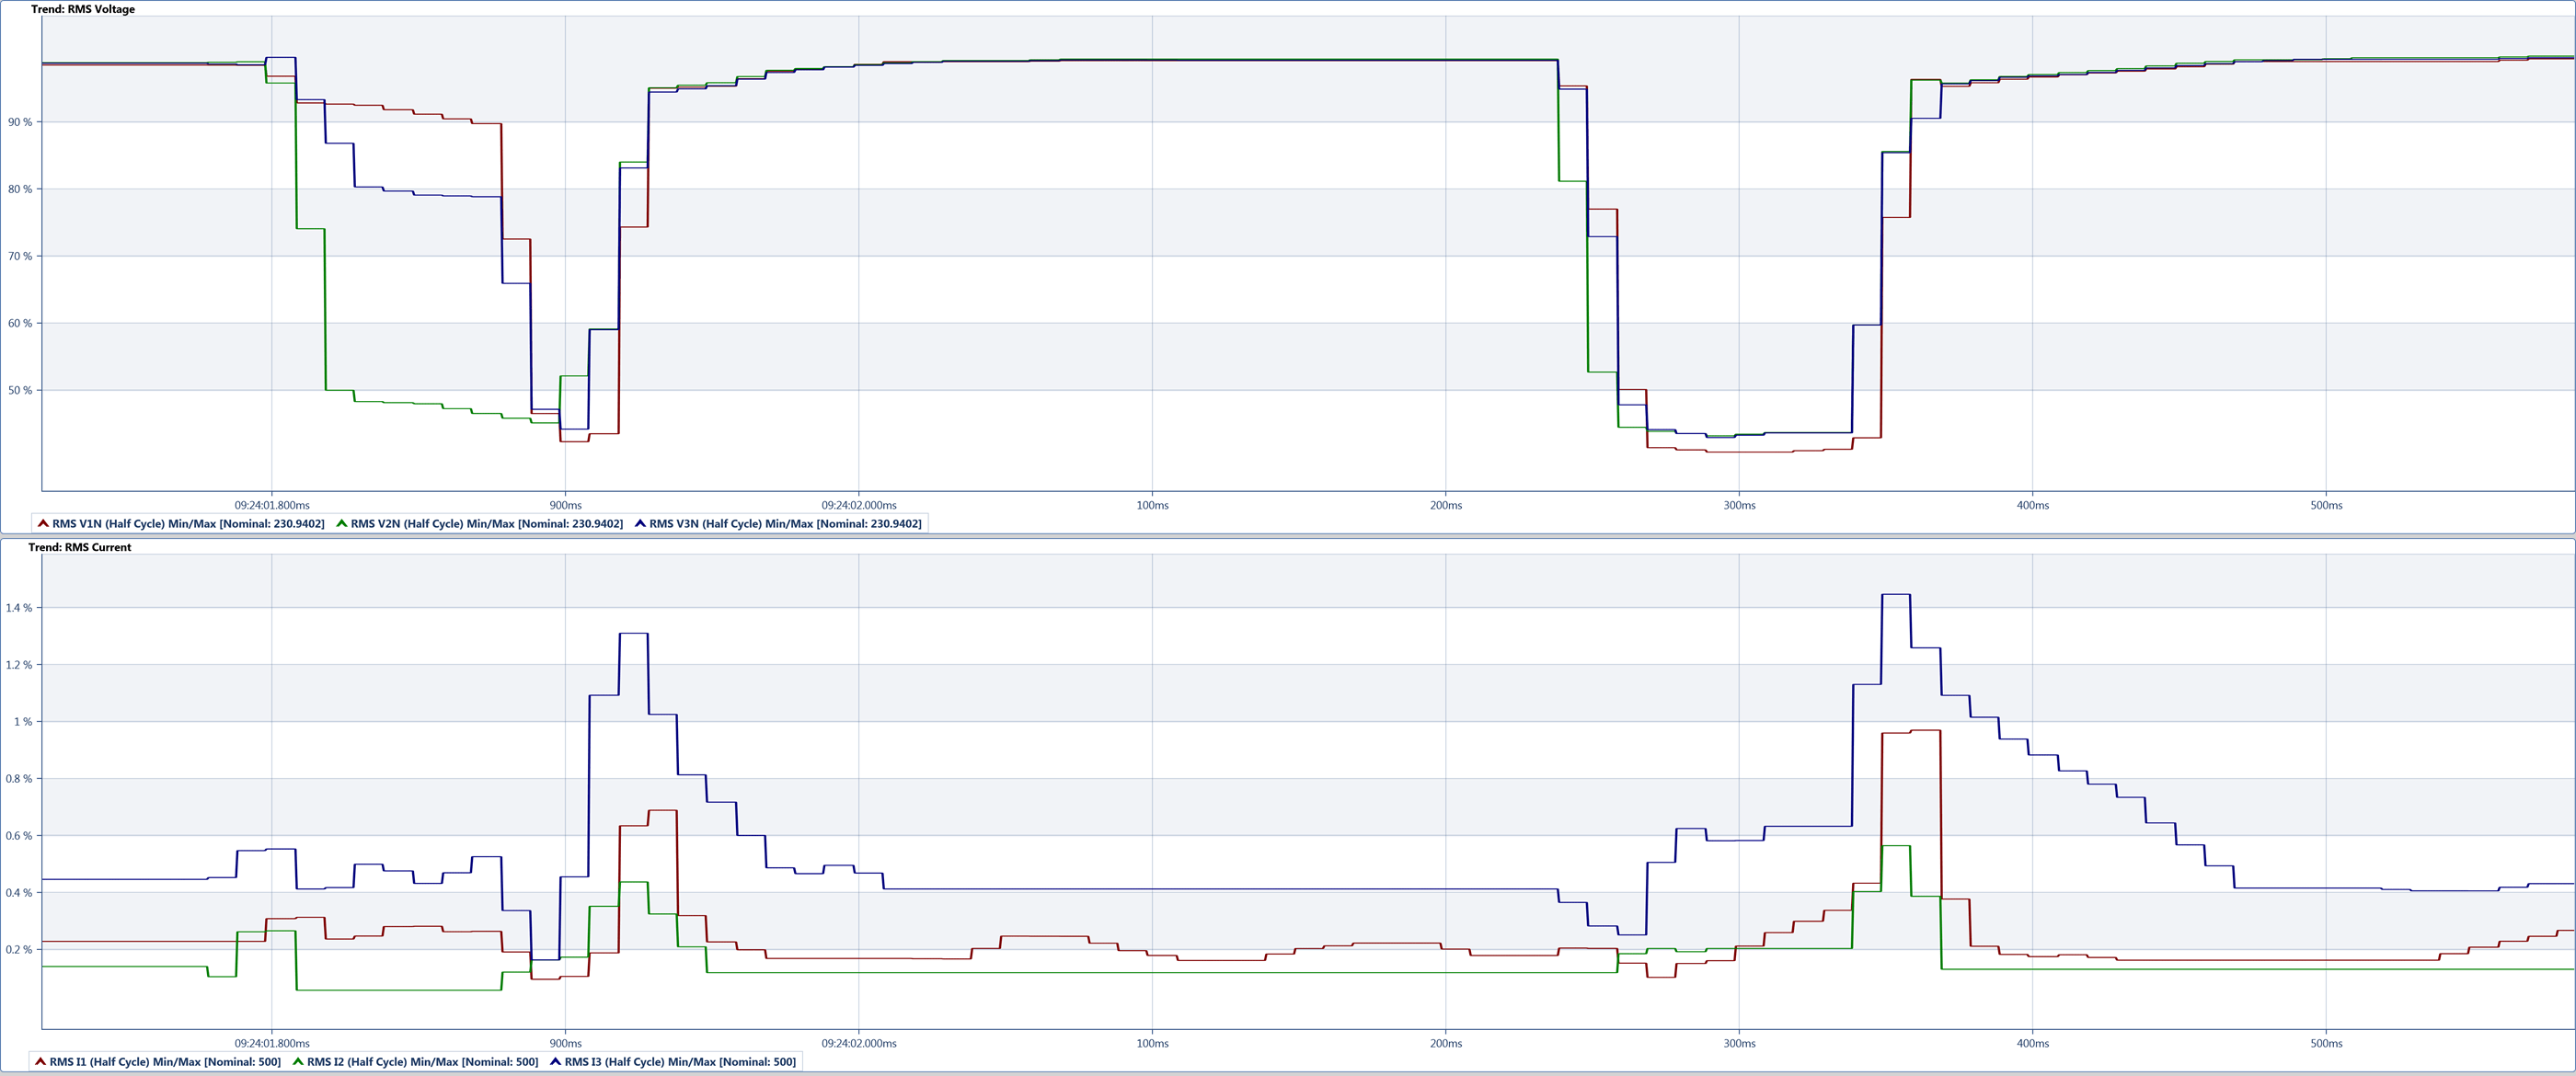
TREND CHART
View electrical parameters for a selected time range as one or more graphs
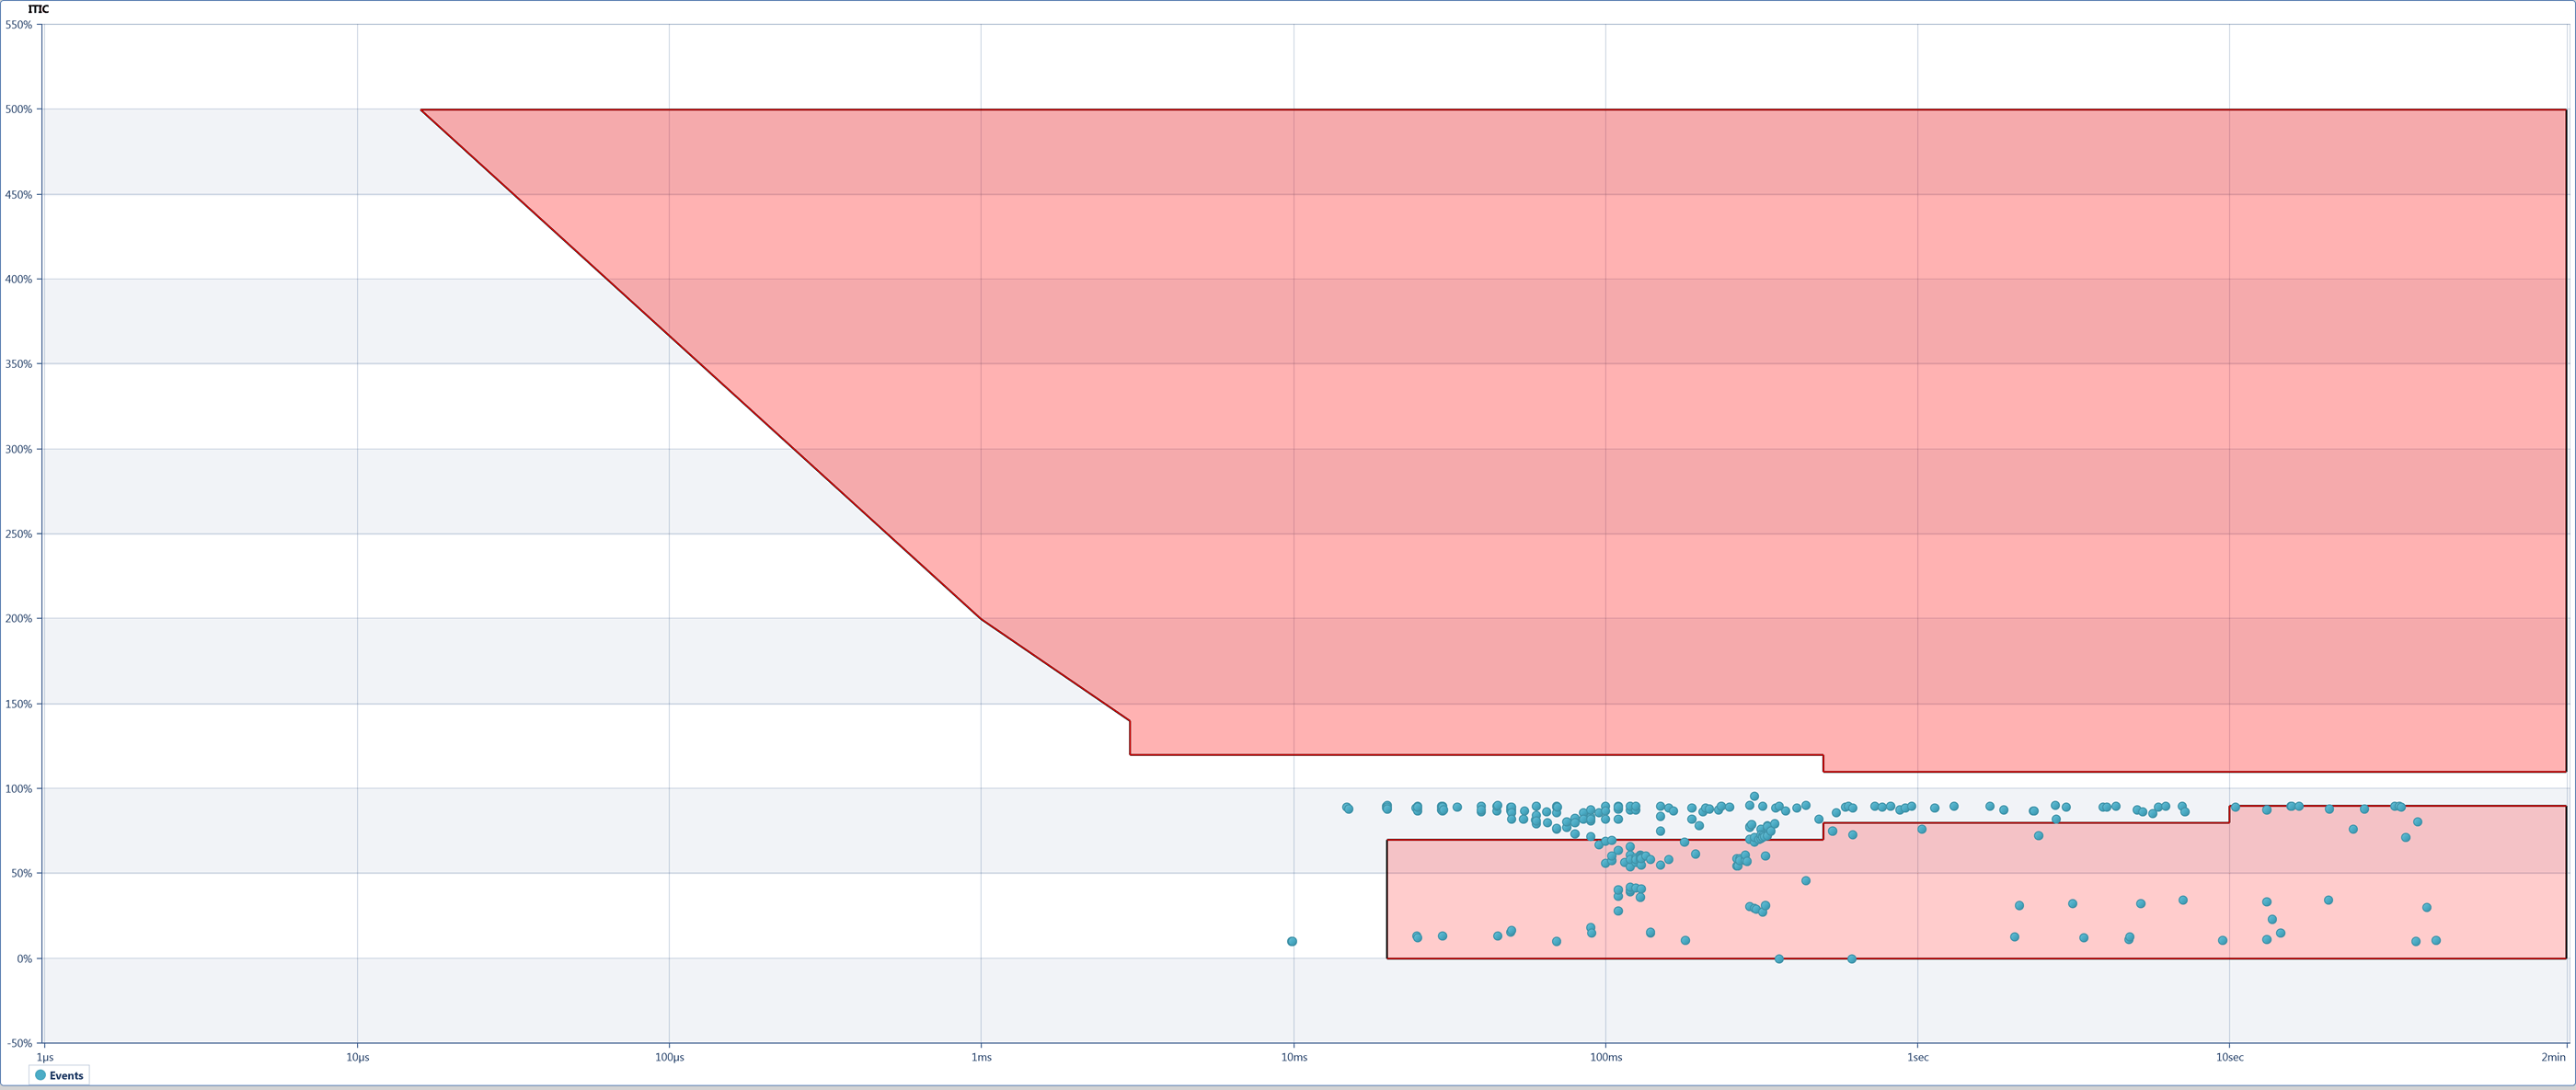
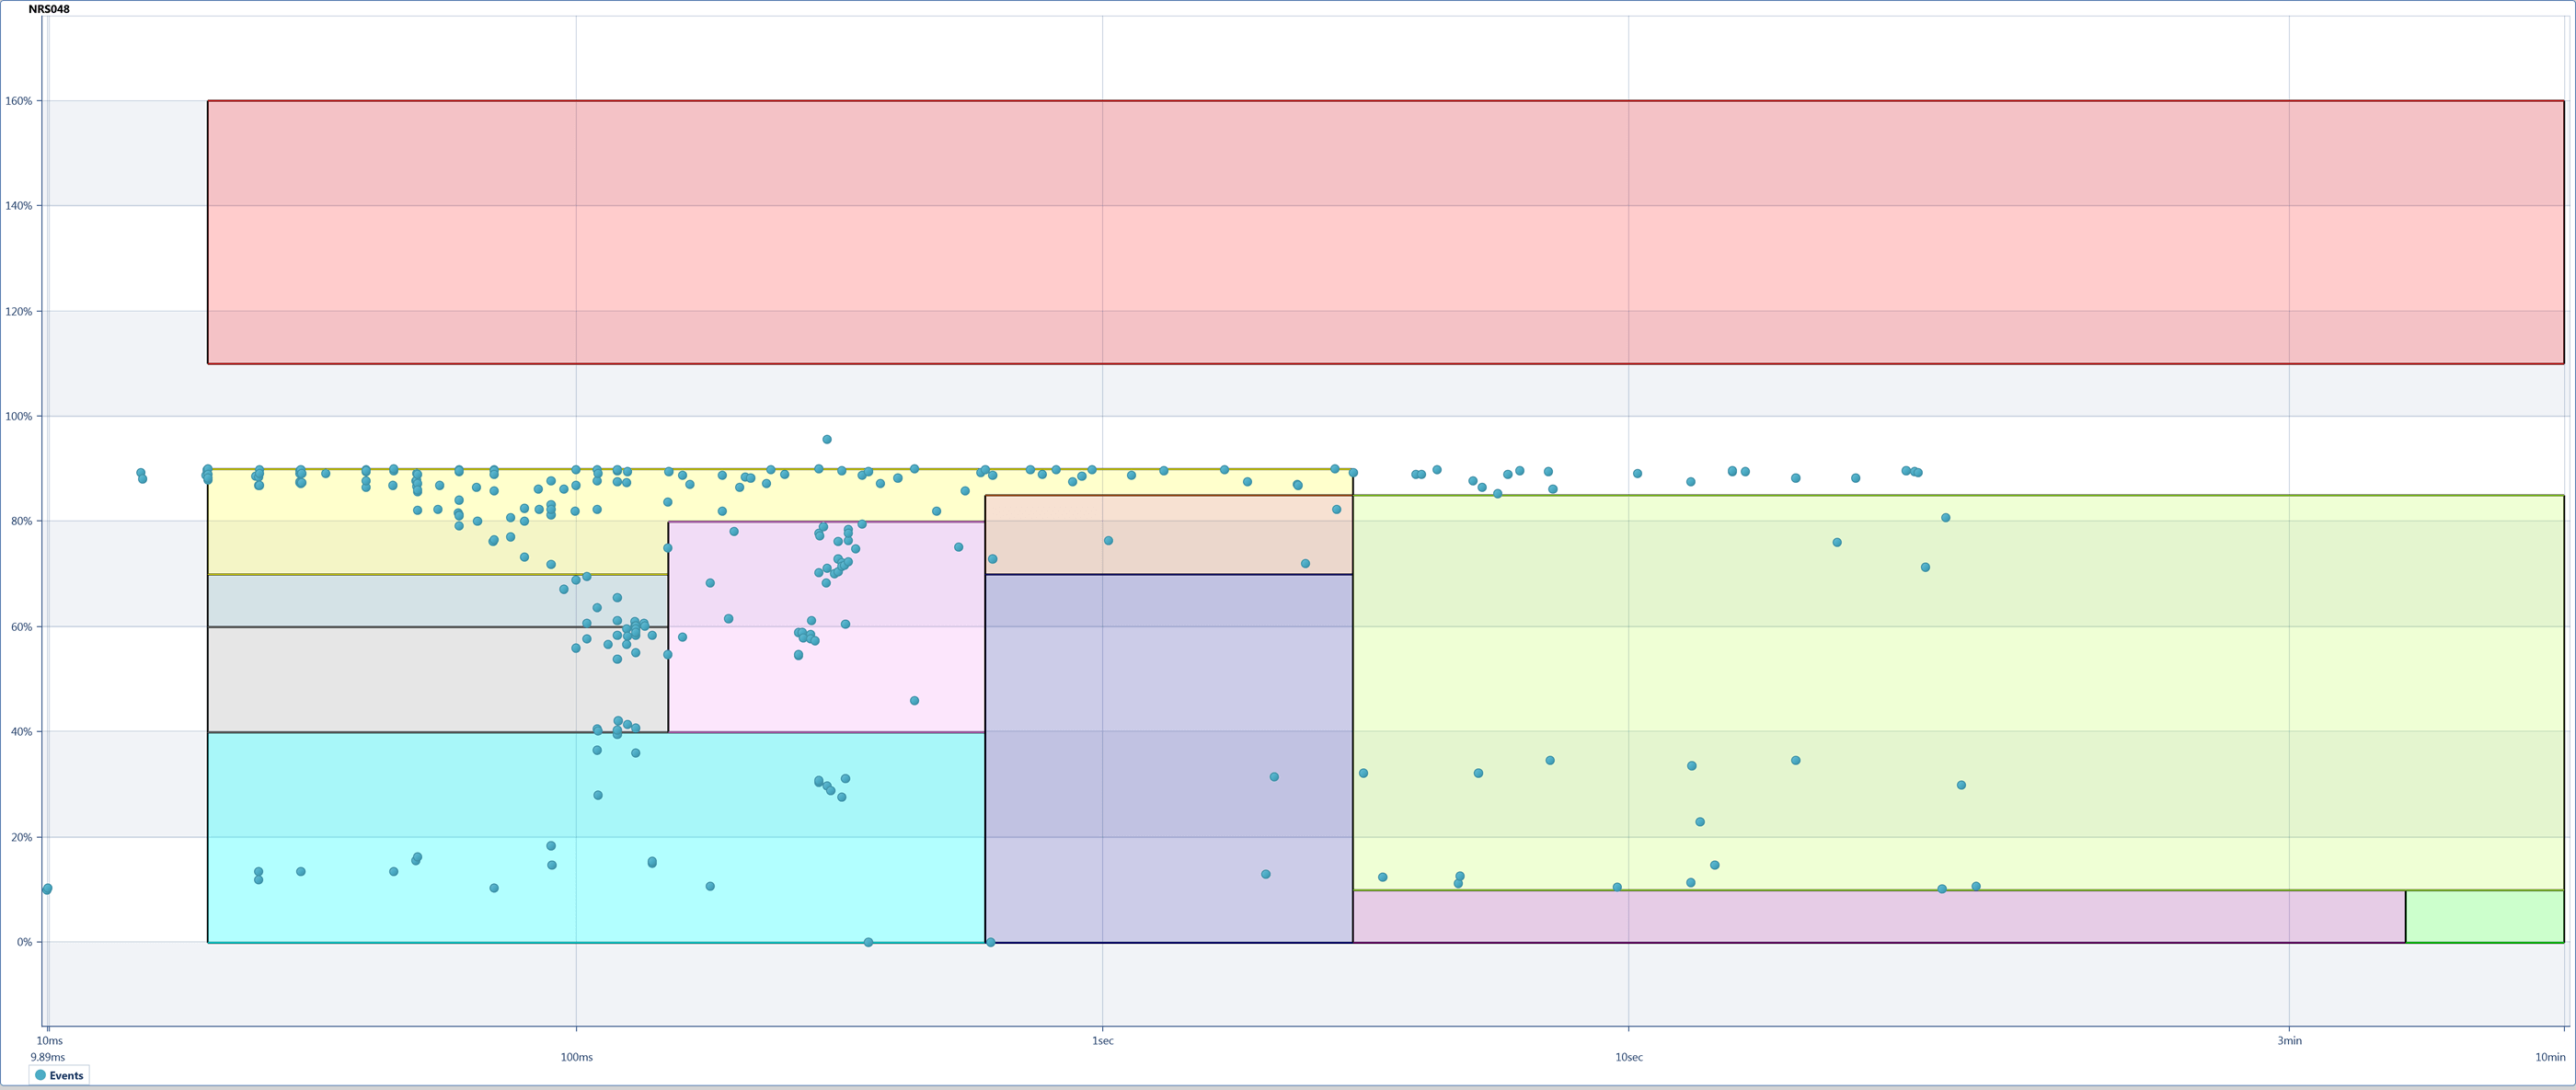
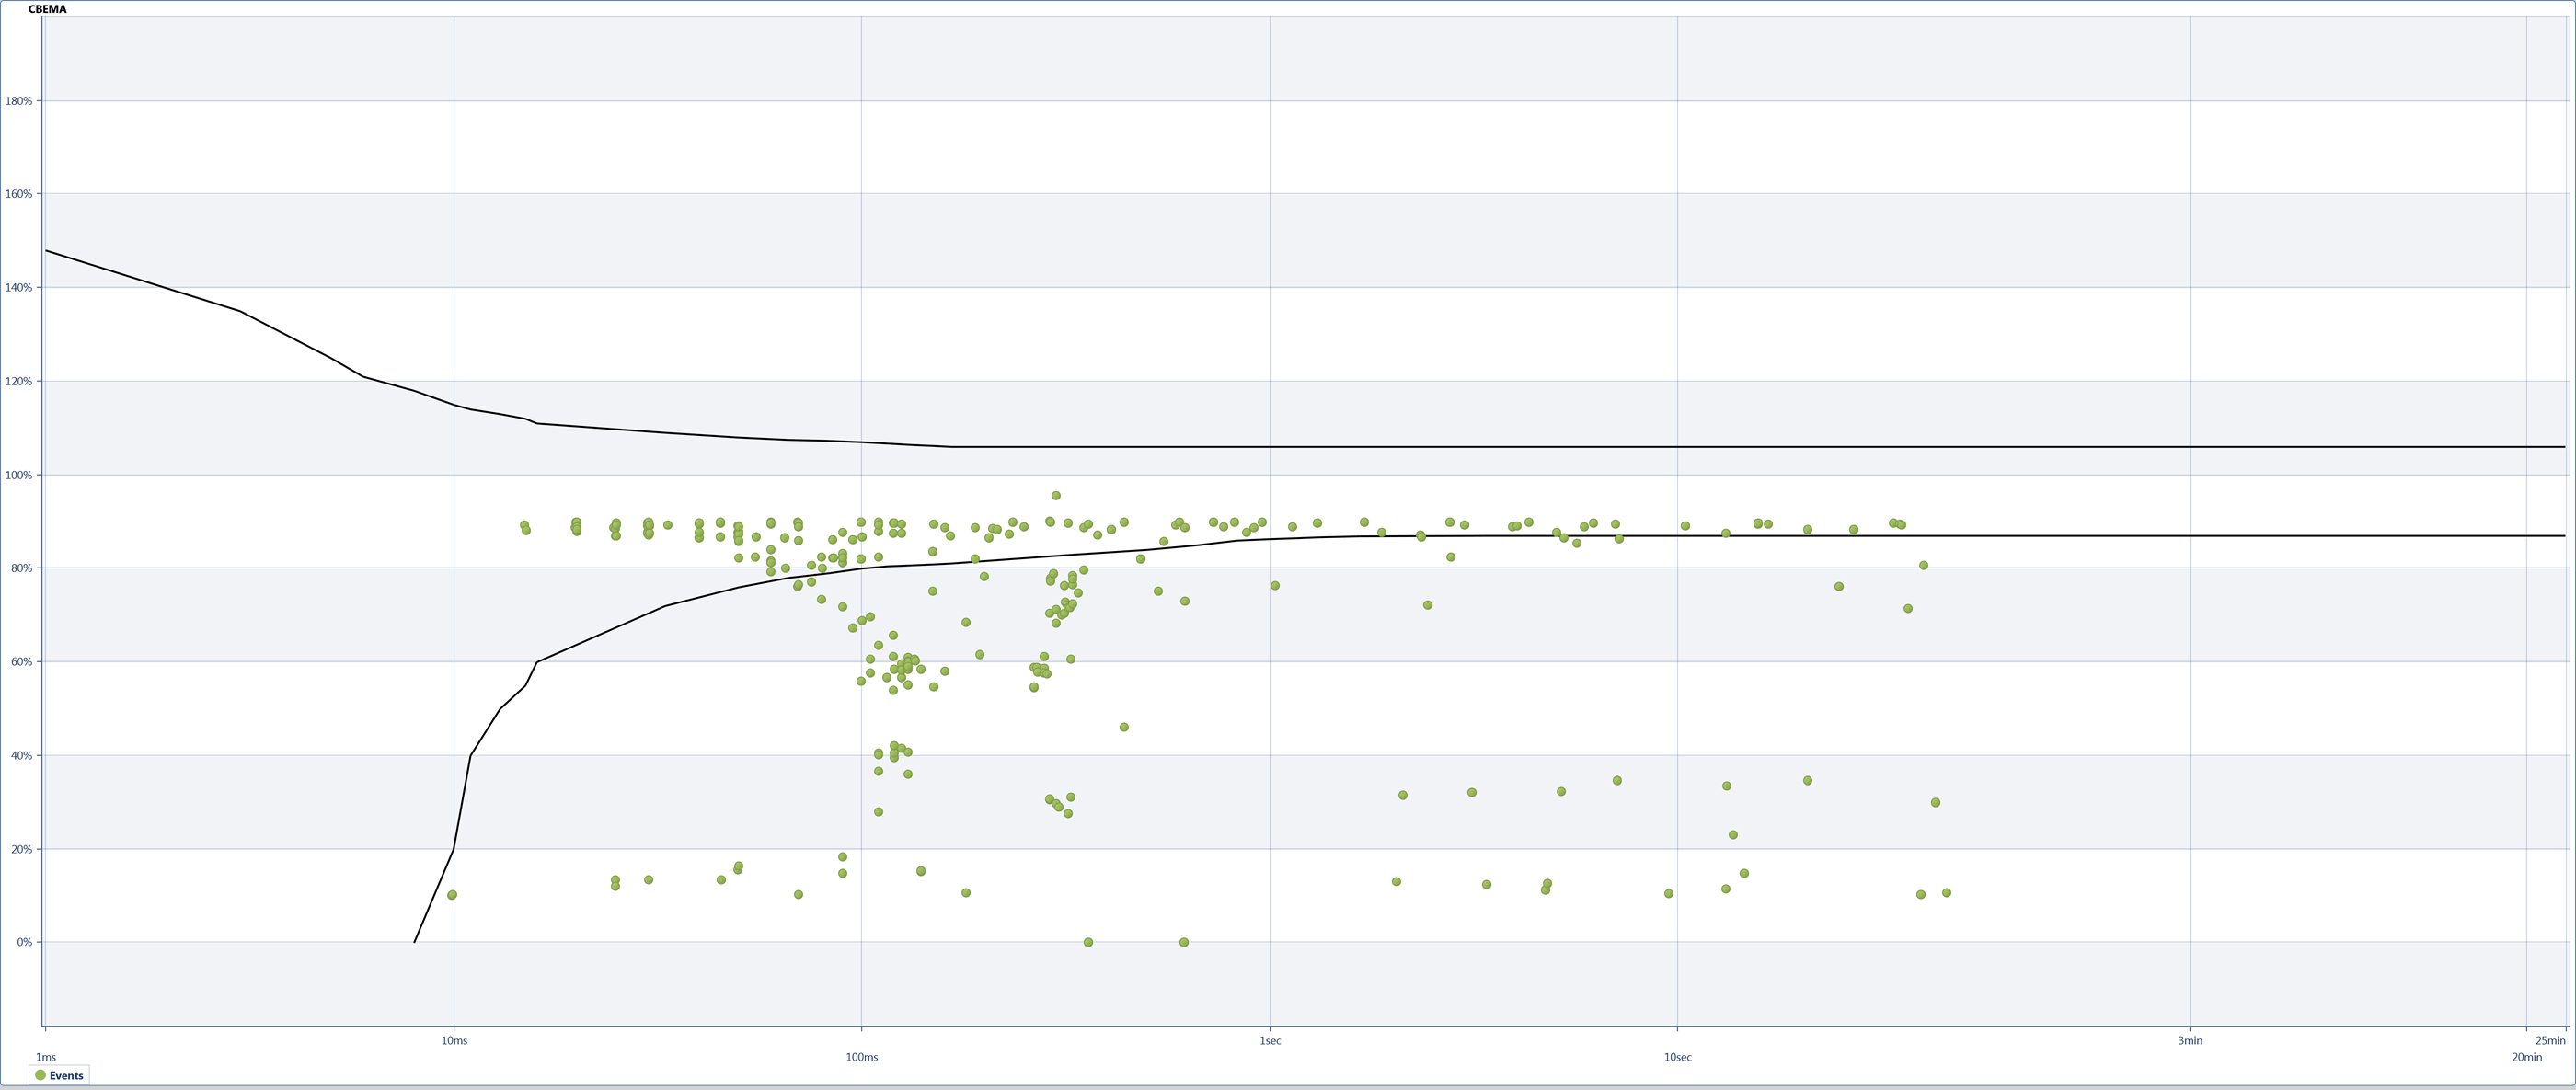
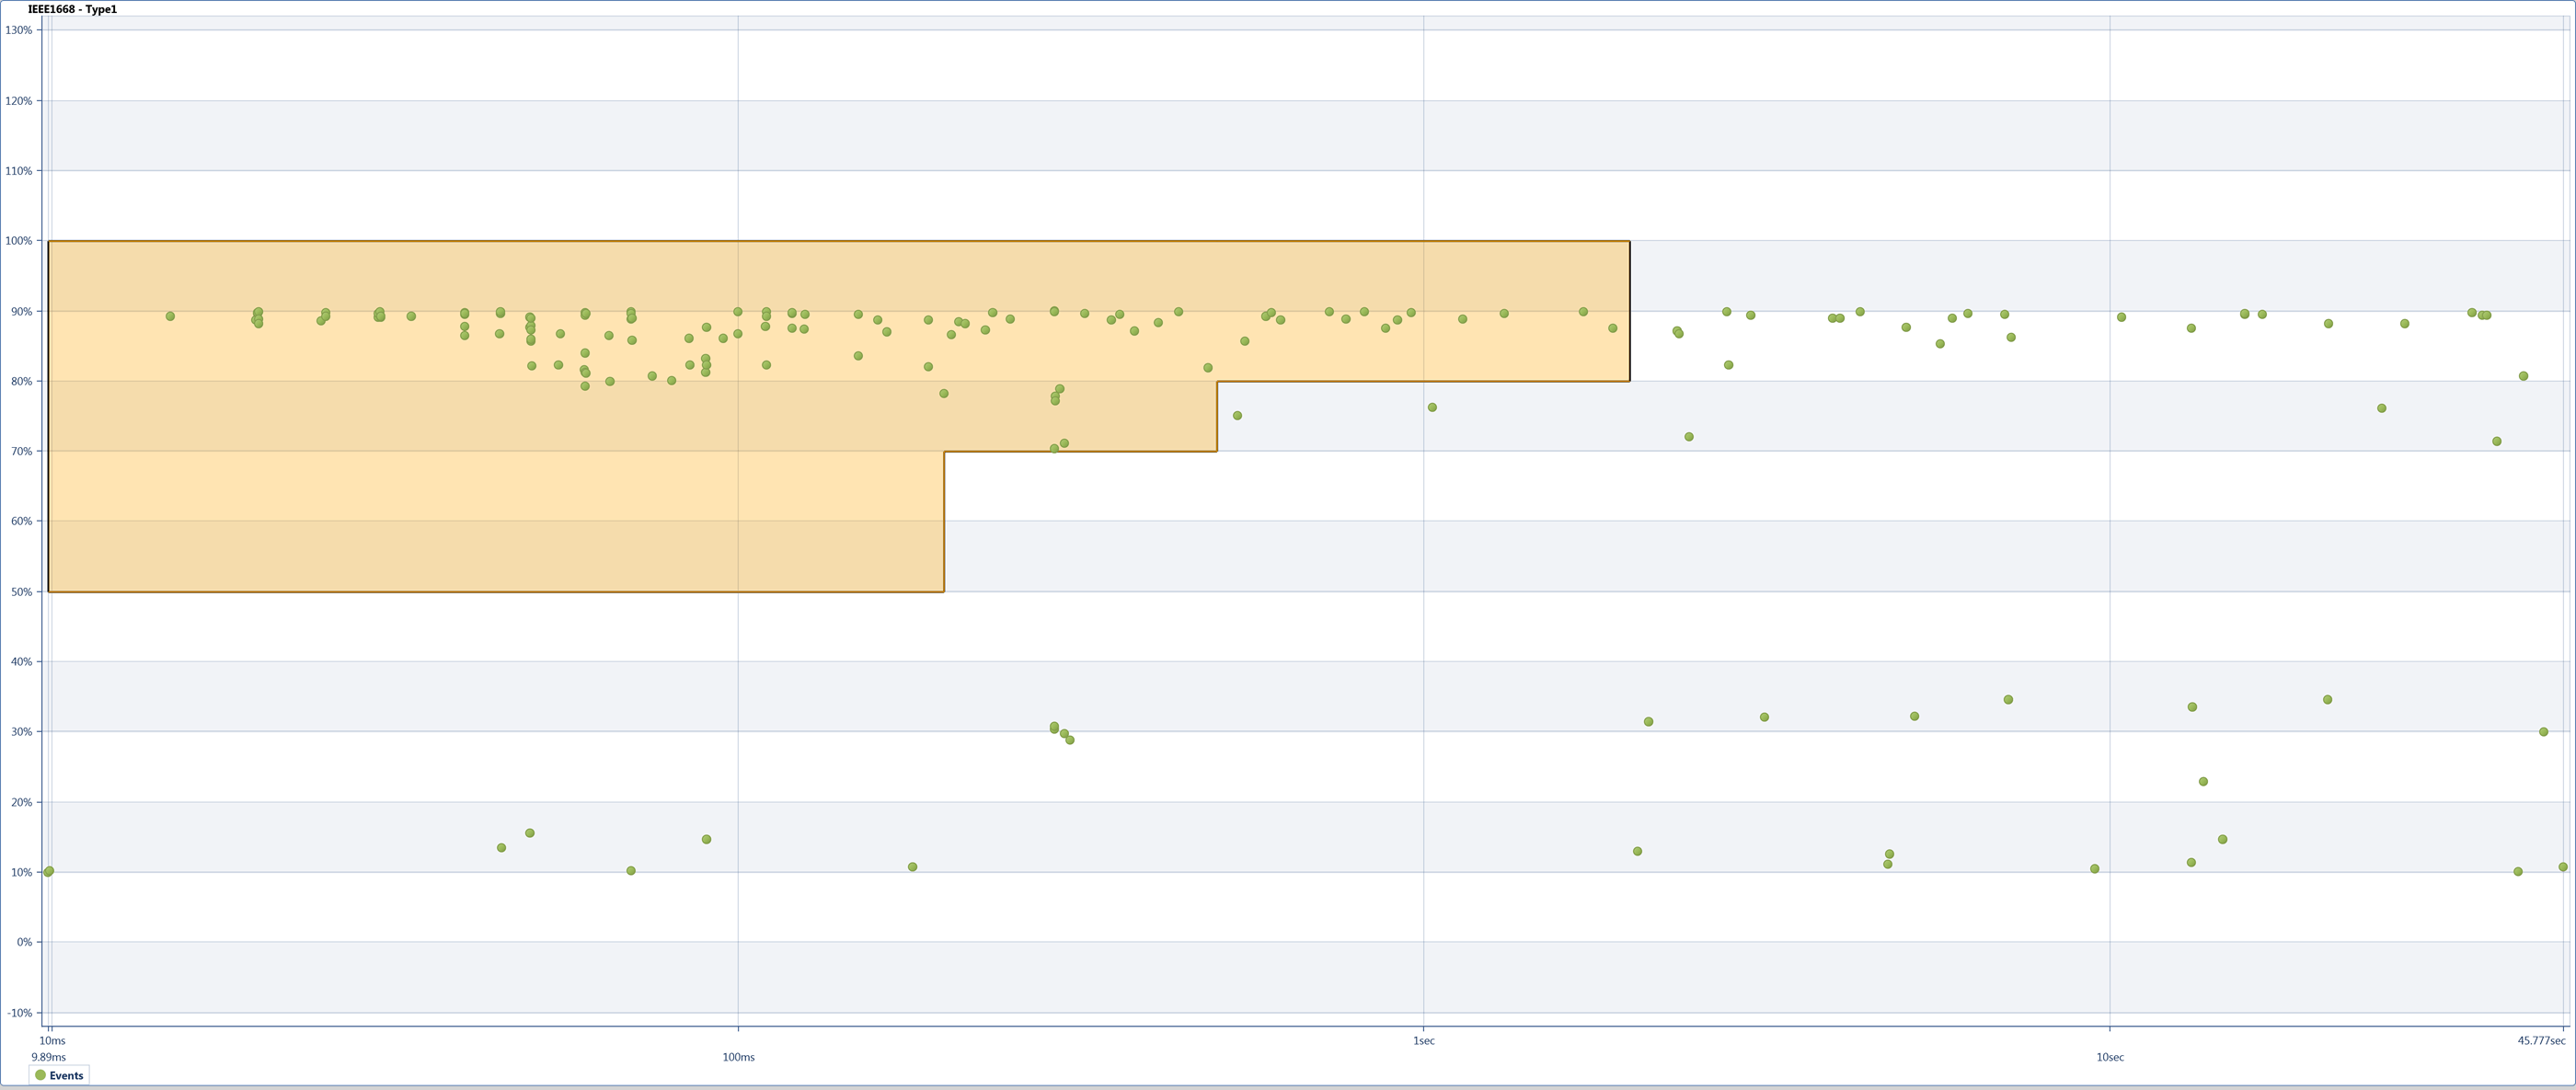
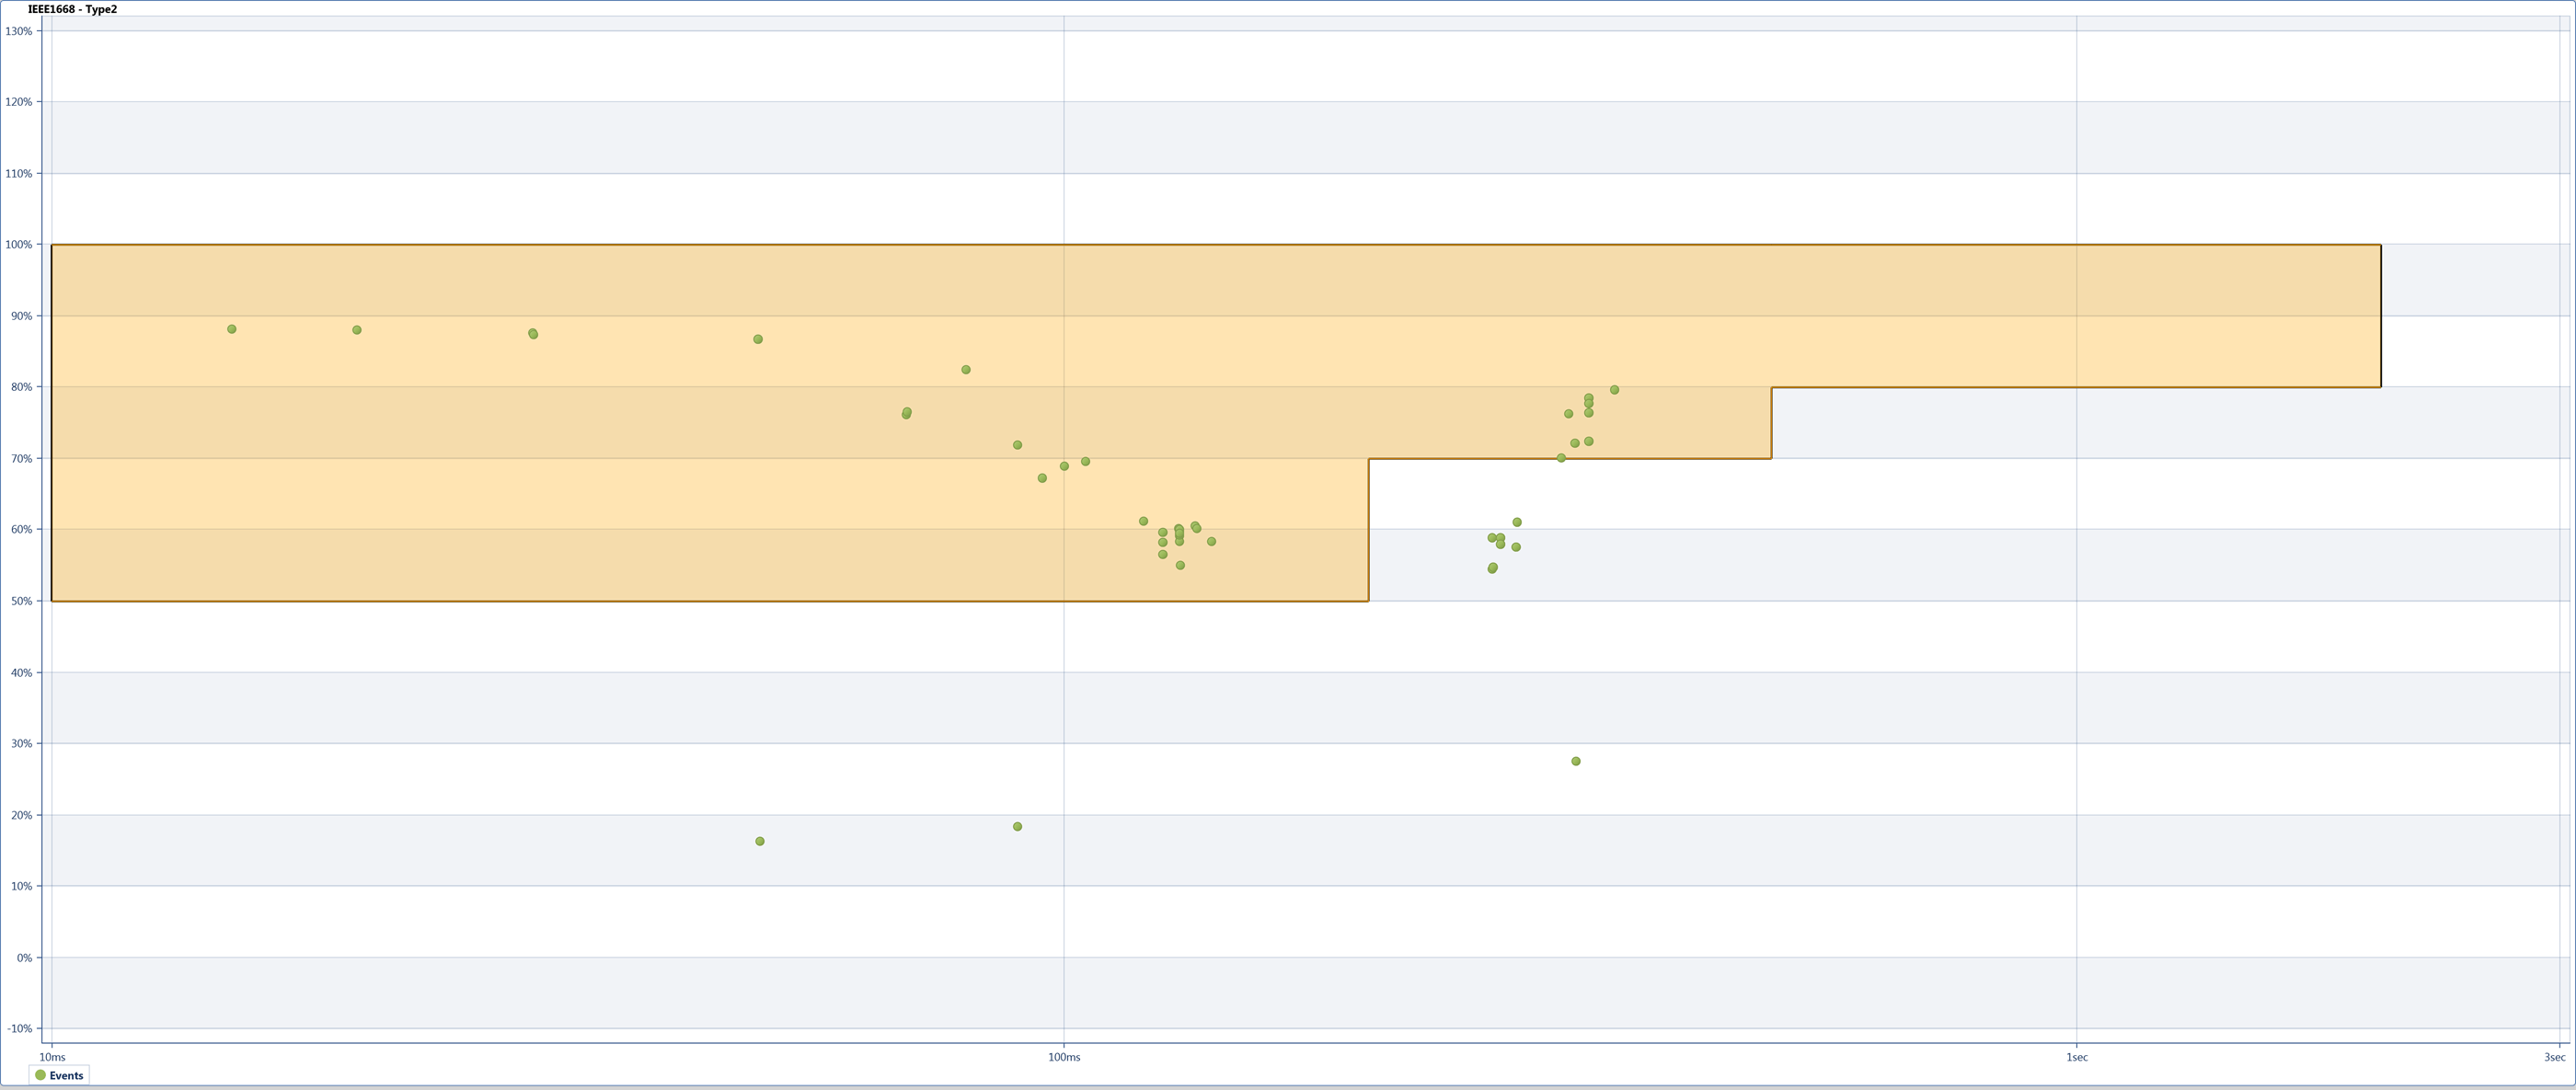
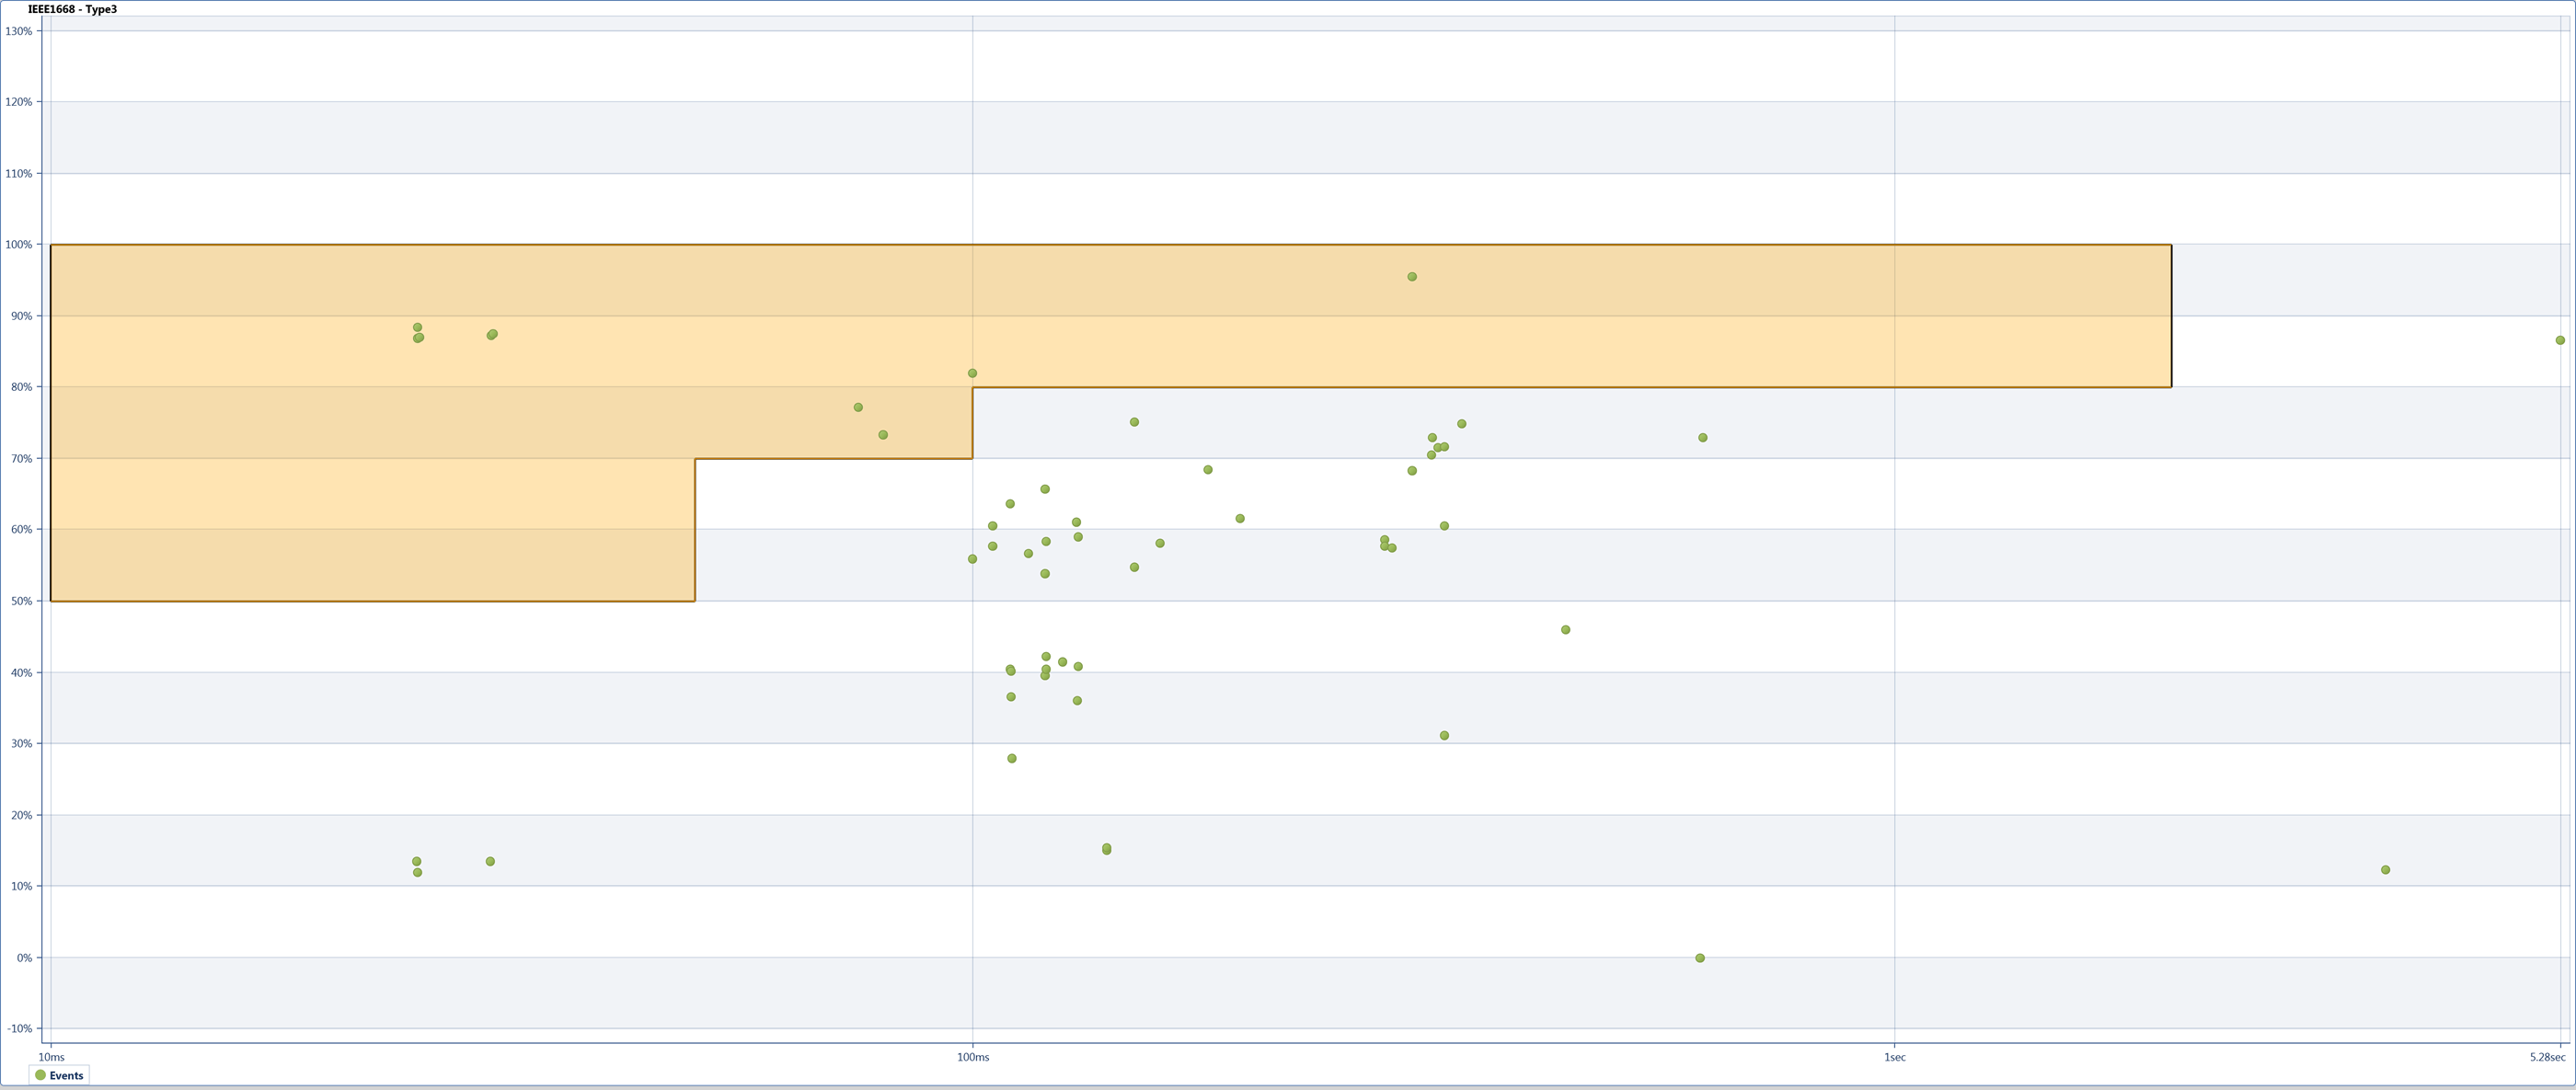
Scatter Event Charts
View events for a selected time range according to standards or custom definition (such as CBEMA).
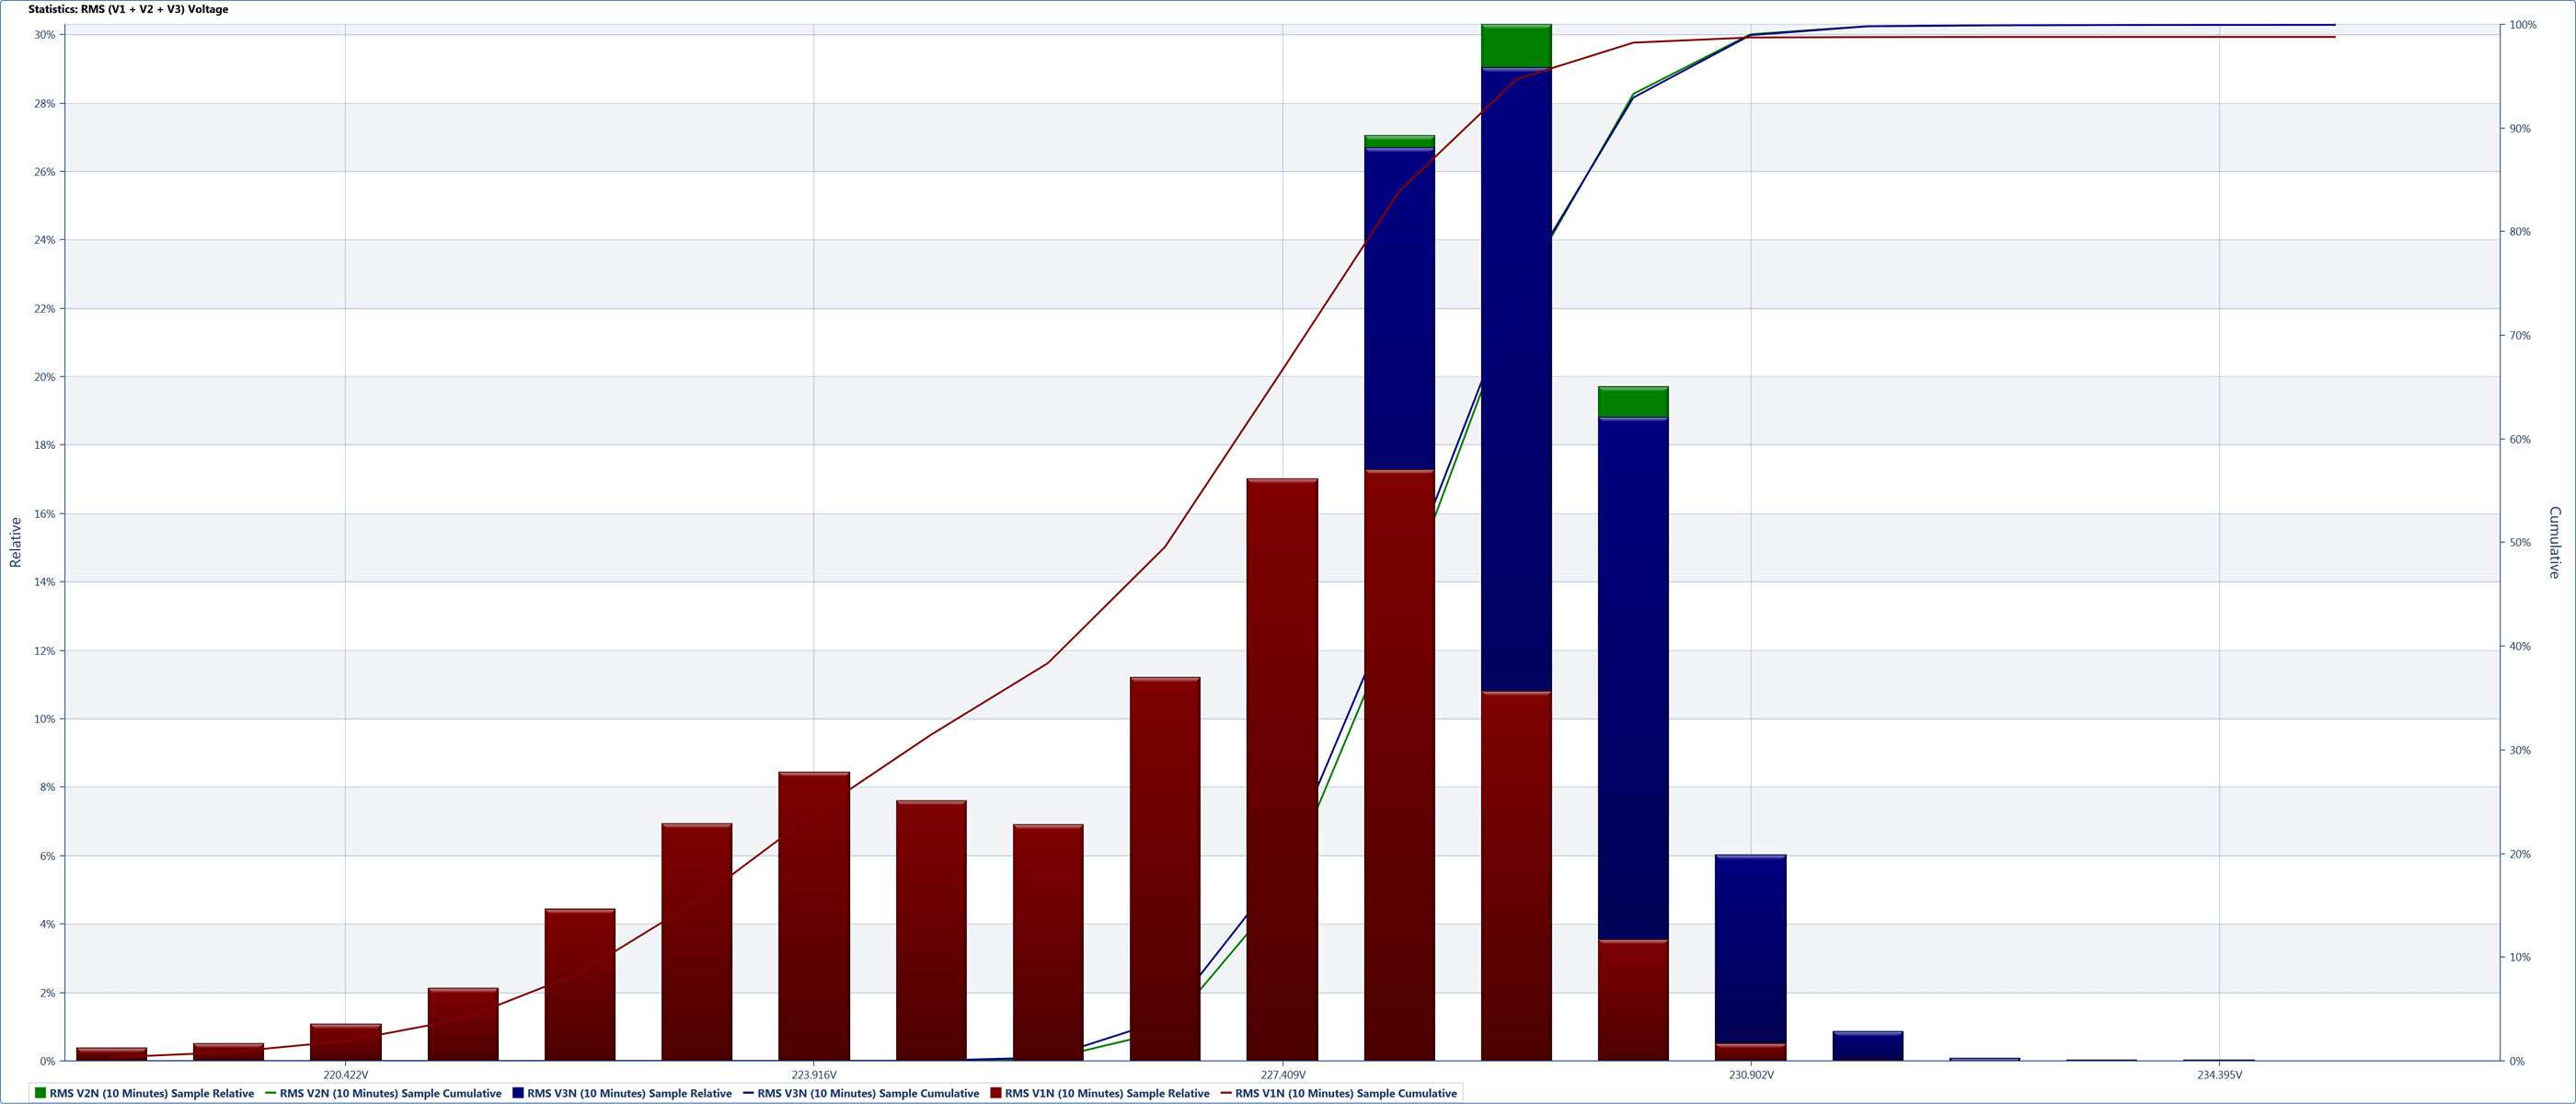
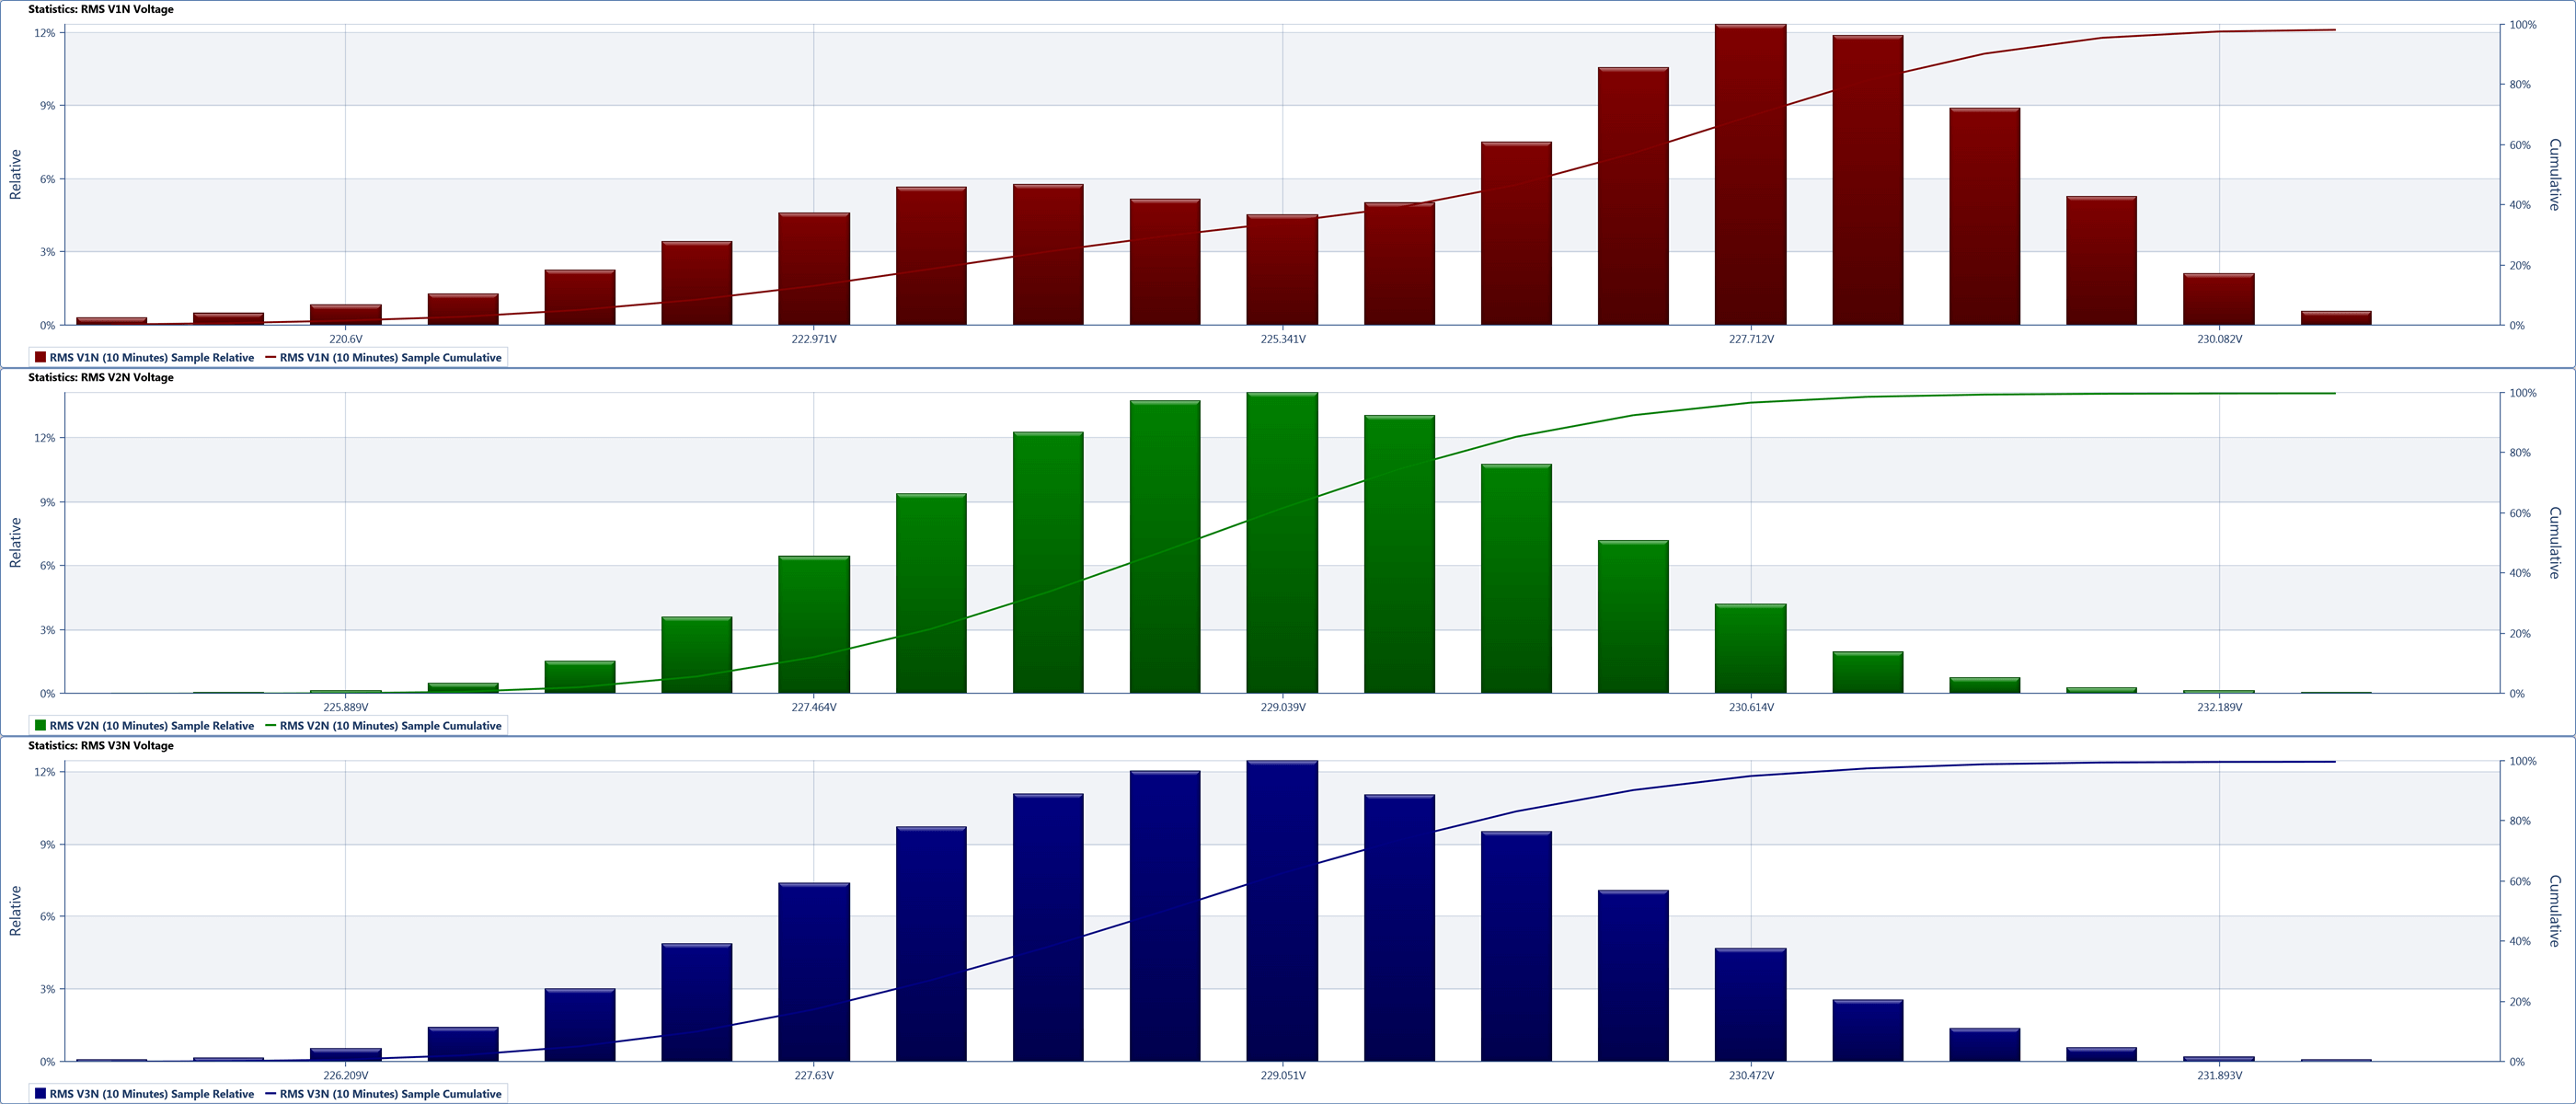
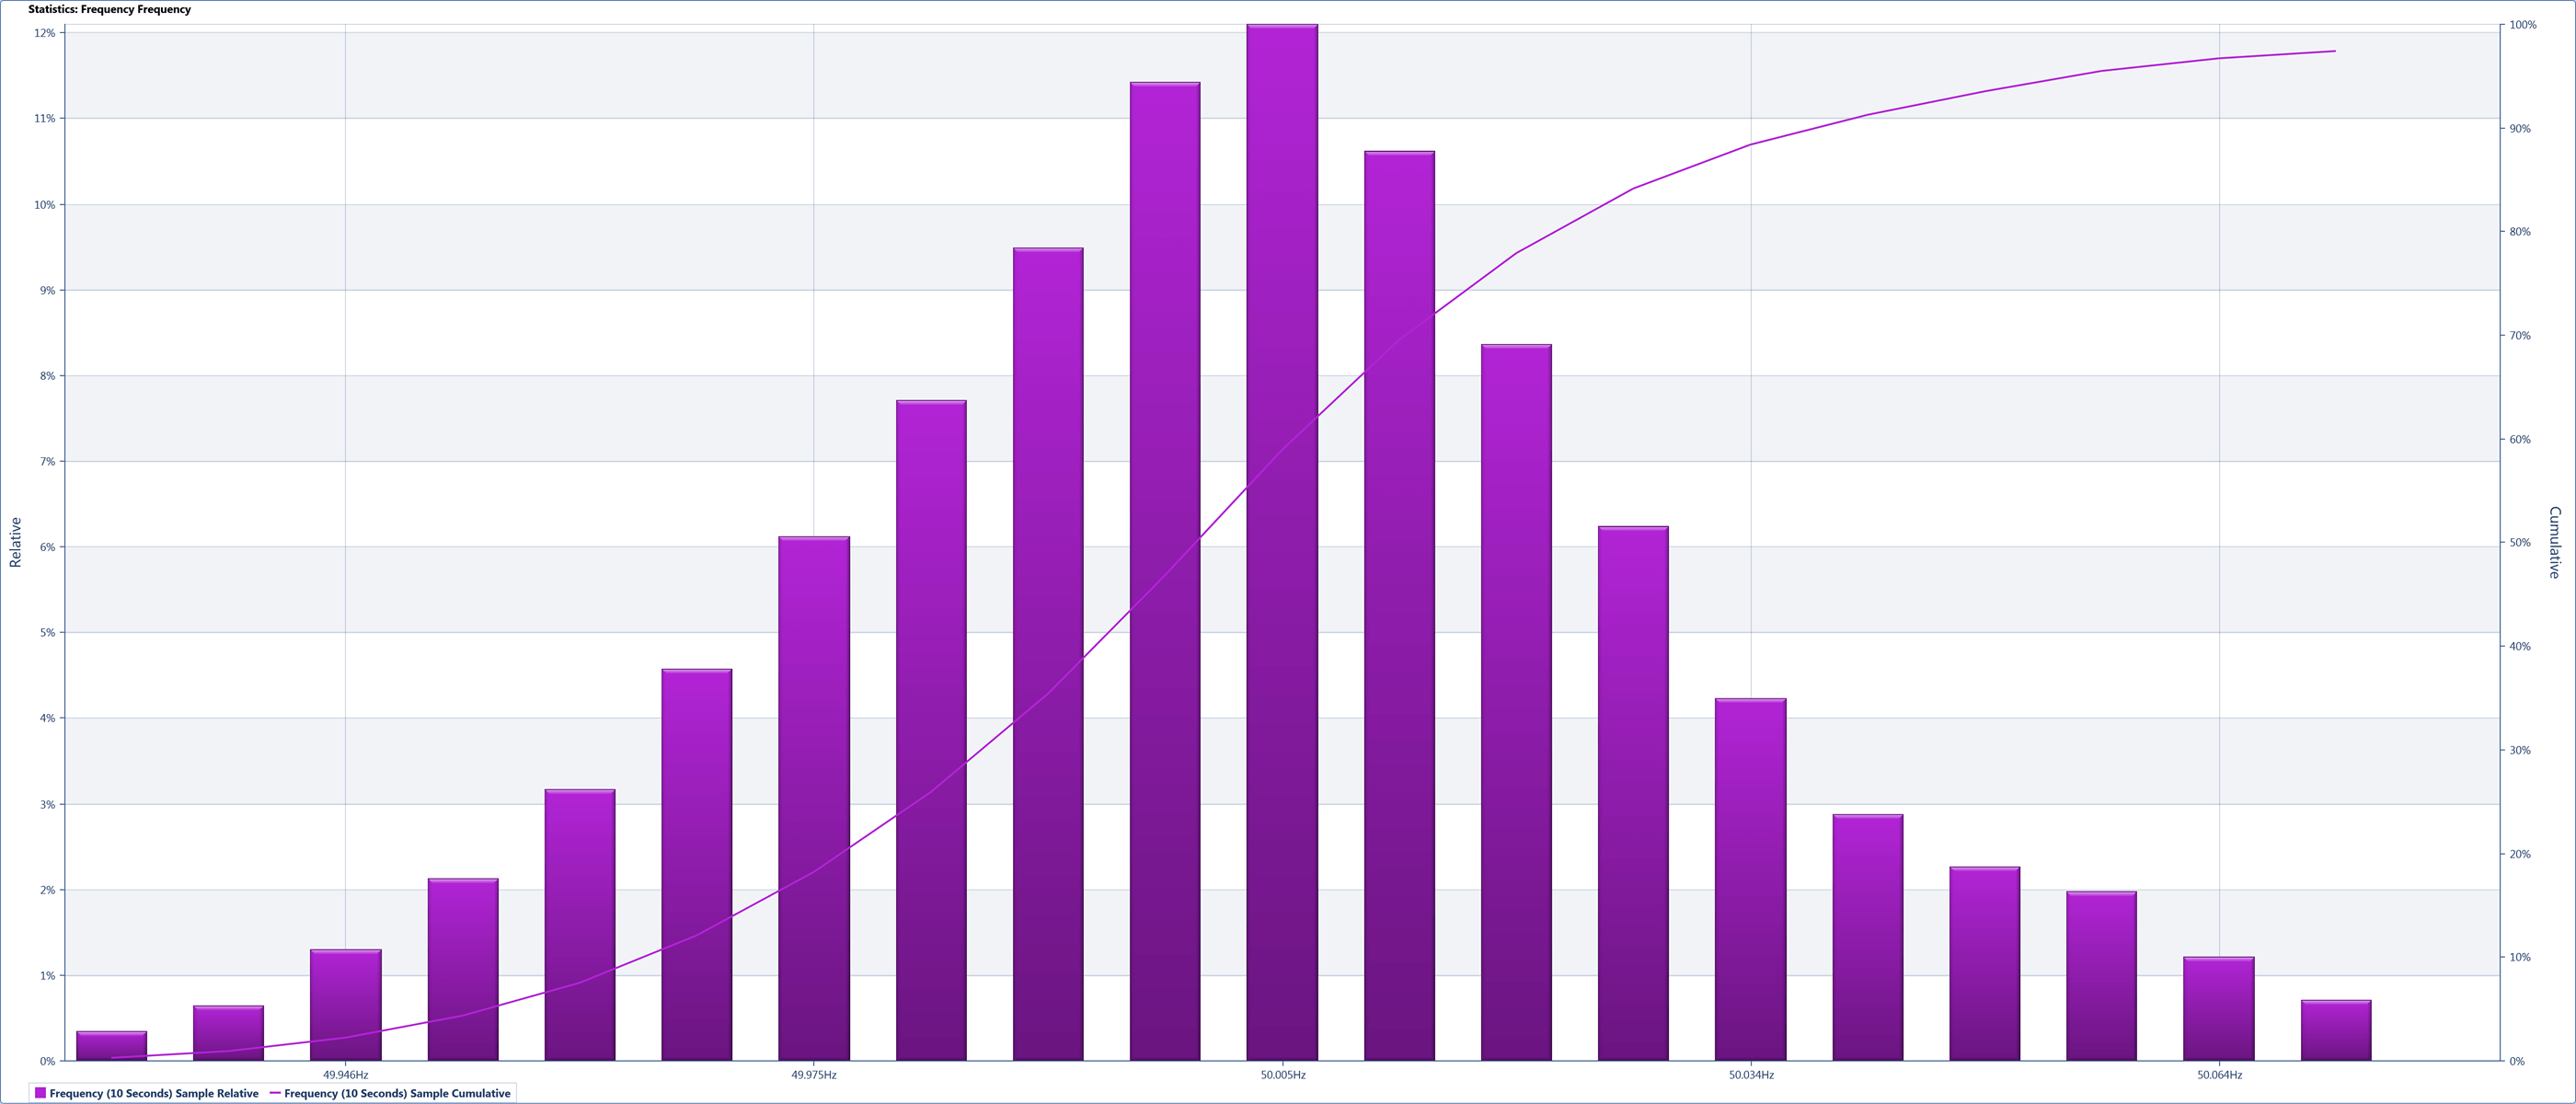
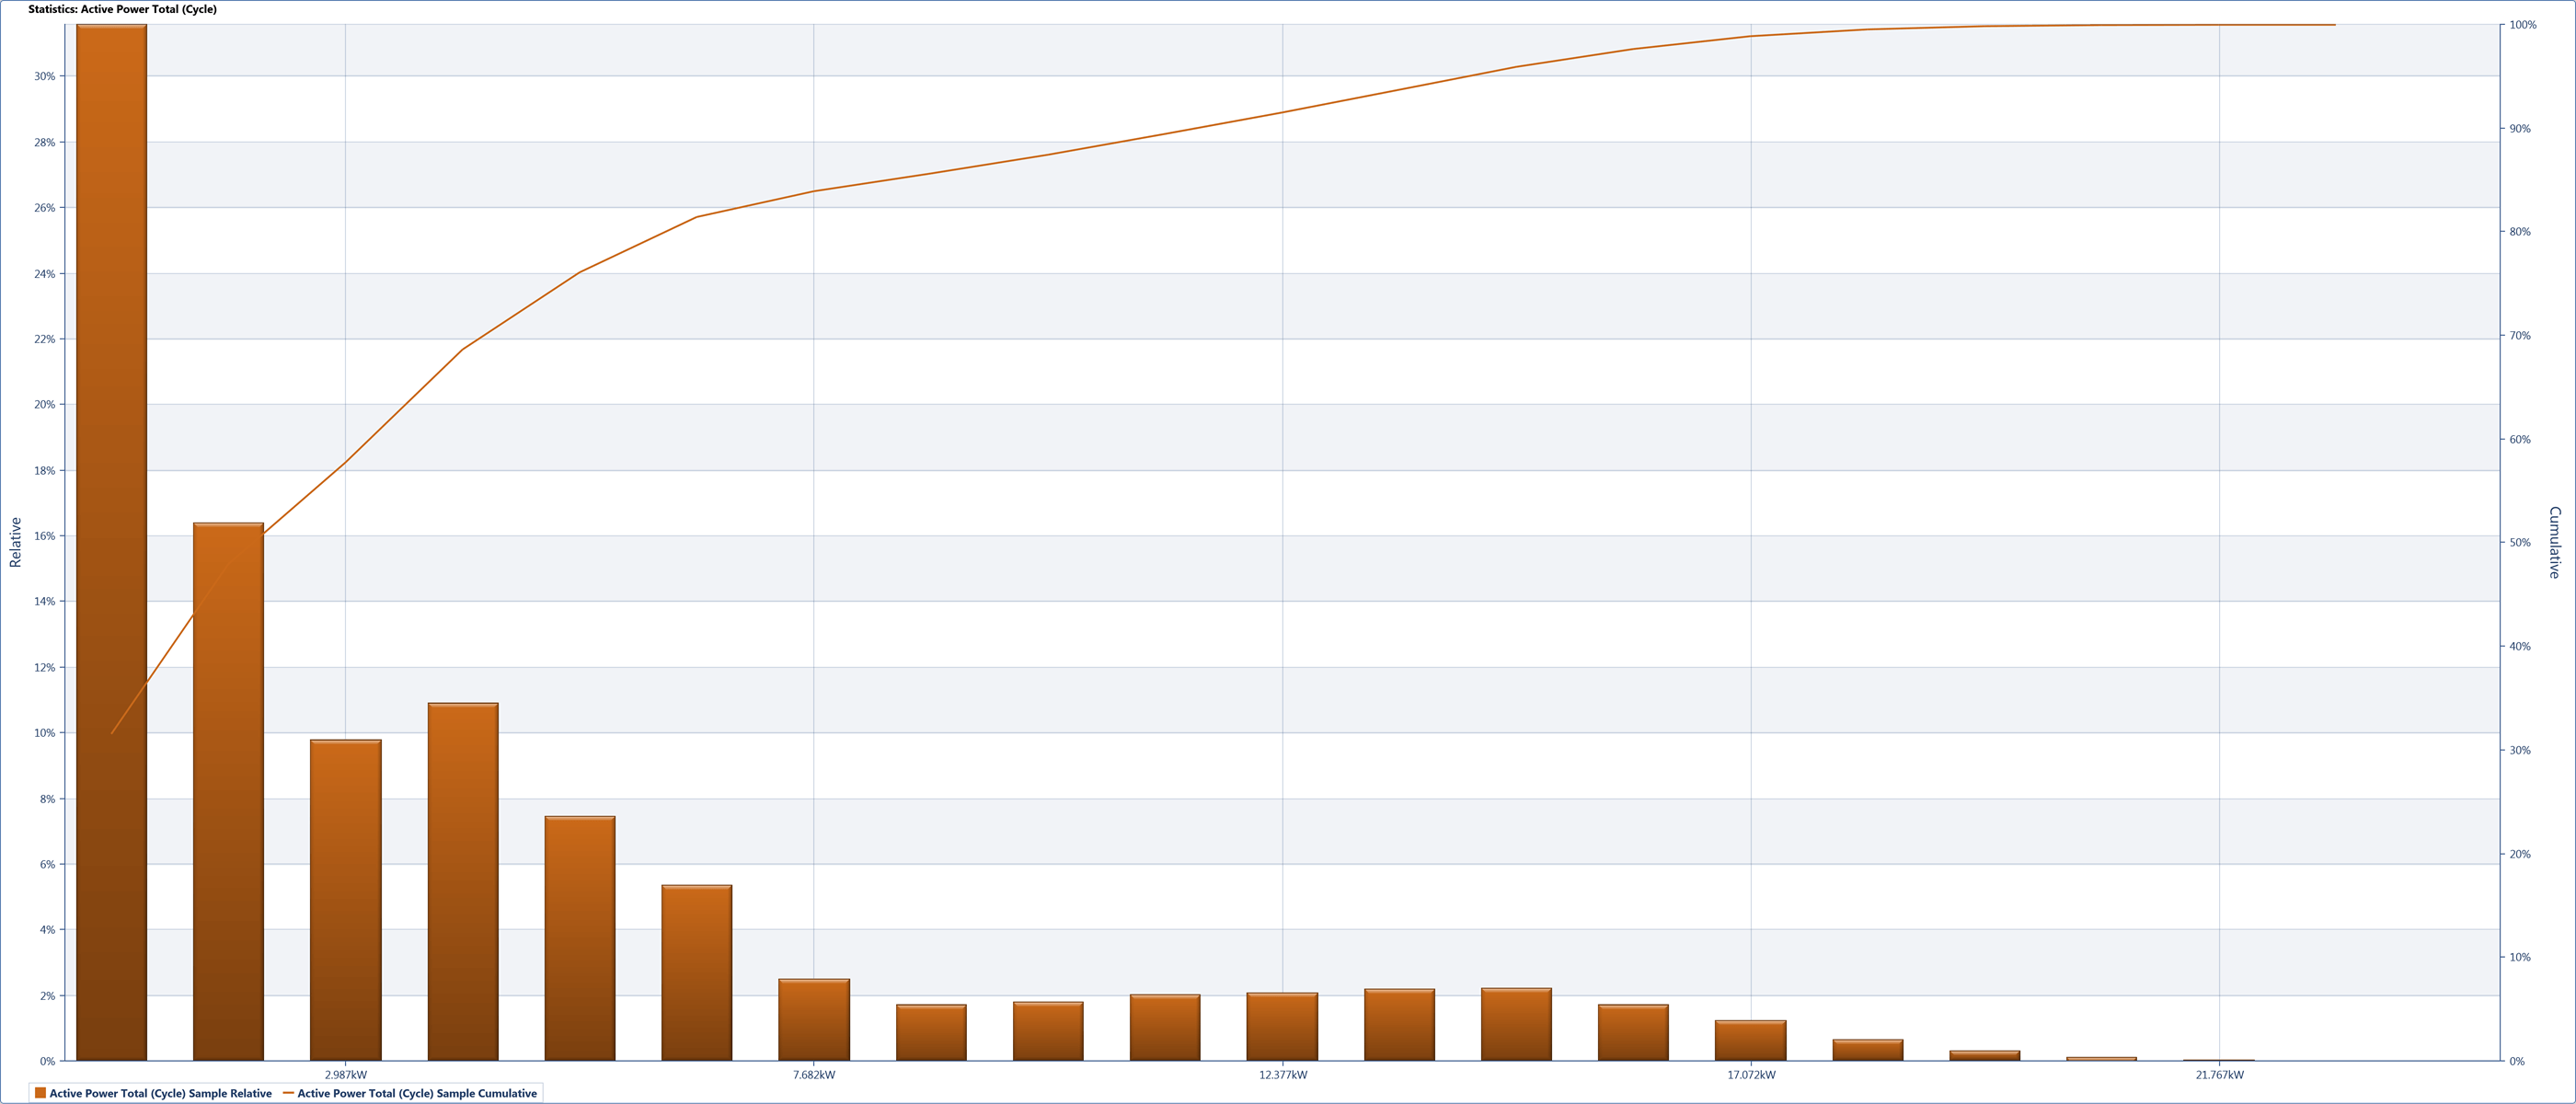
Statistics Chart
- View selected parameters for a selected time range.
- Any Parameter (10,000)
- Any time range
- Drill-in to range
- Flagged data
- Min, max, Average and Standard deviation
- Configurable Percentile values
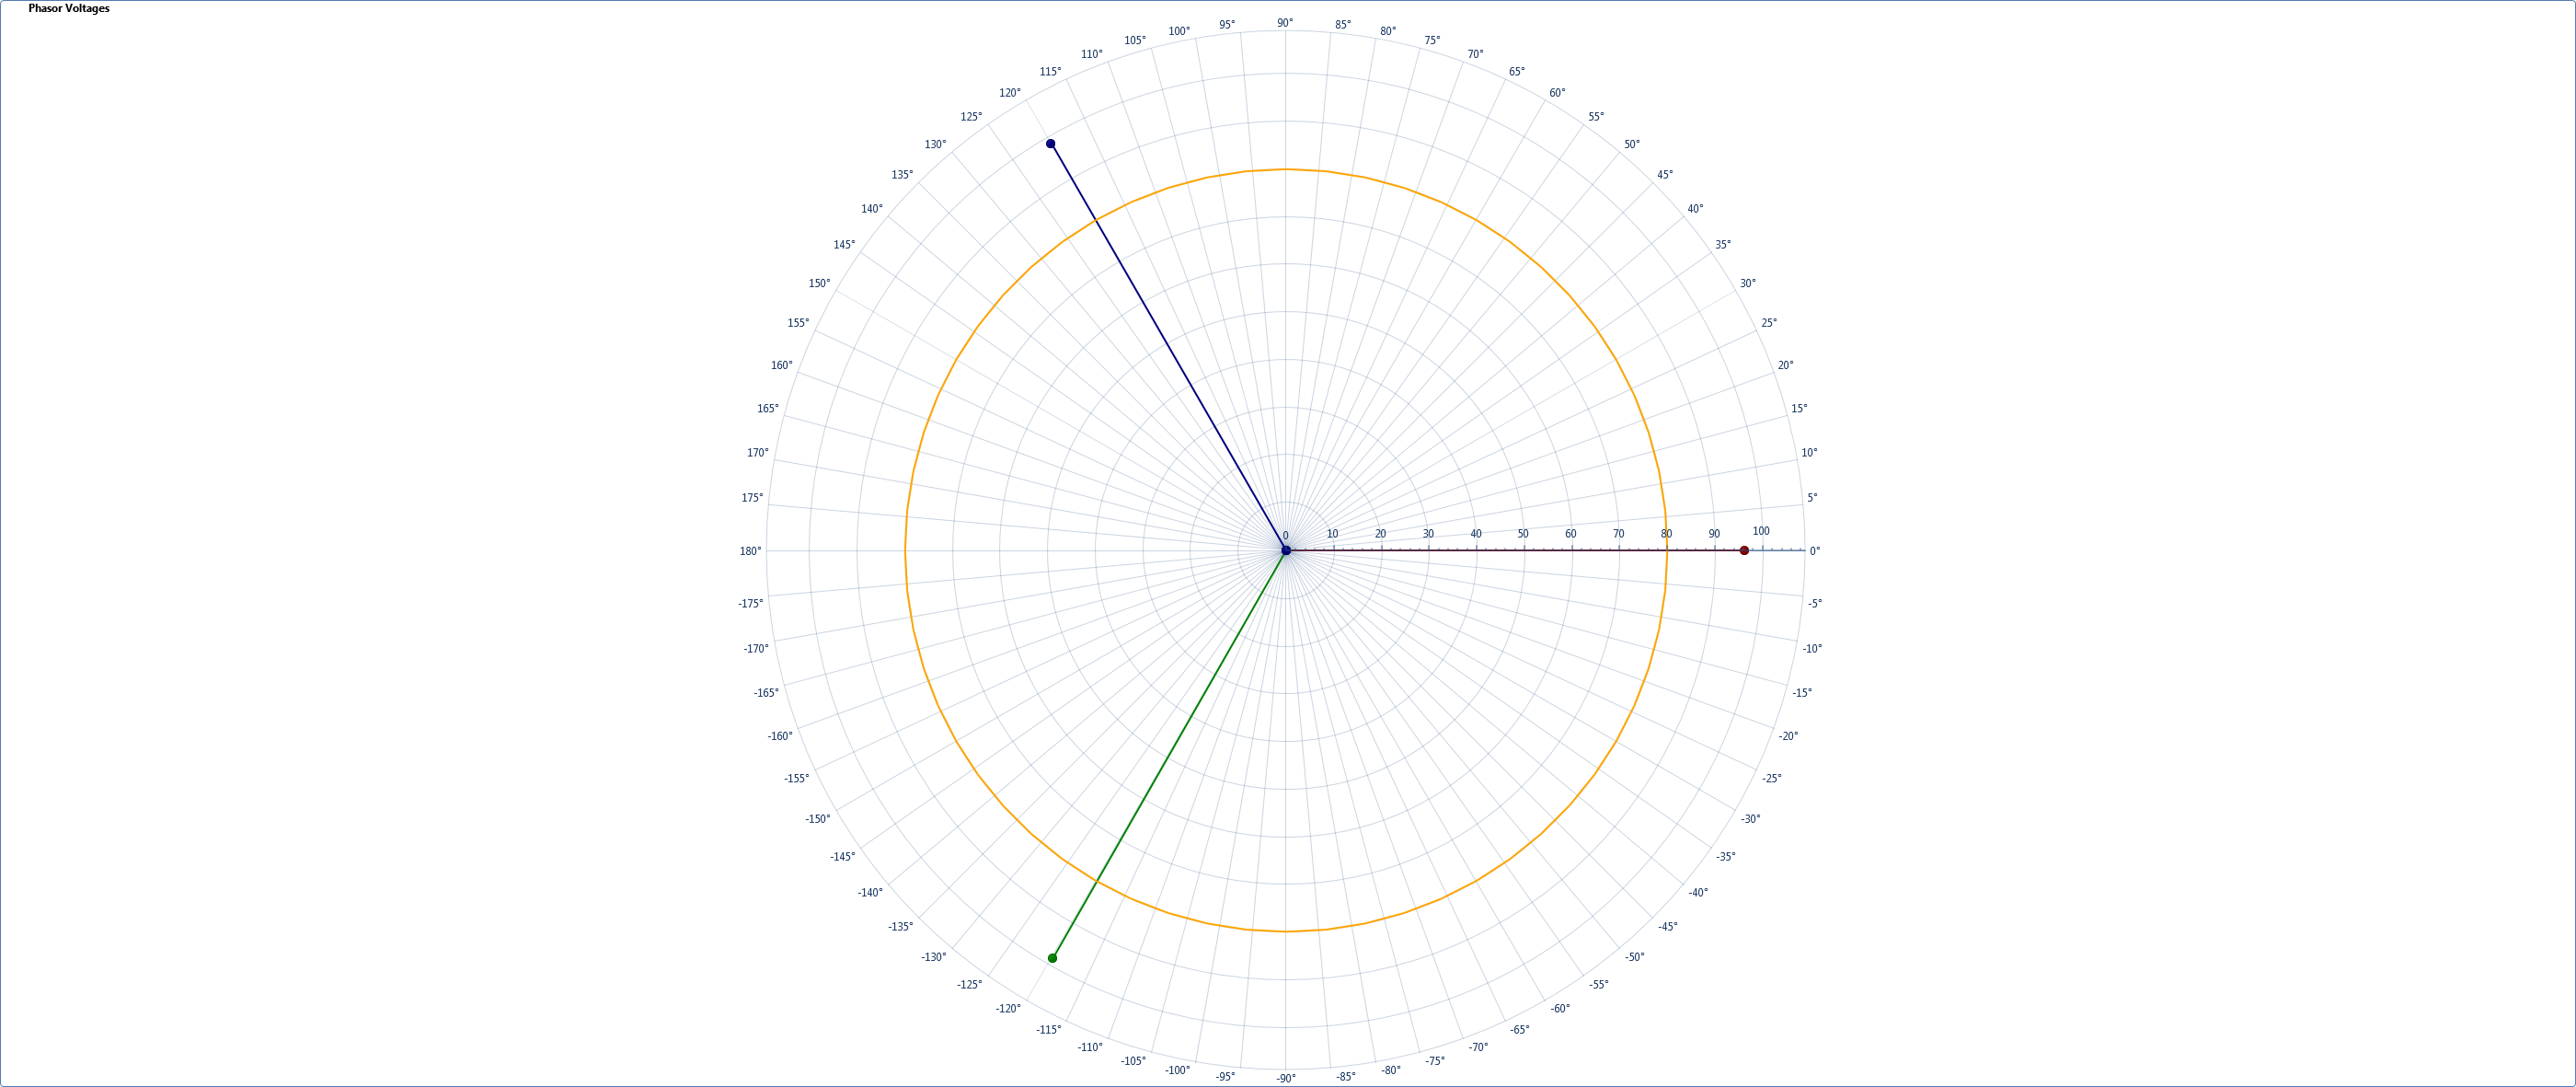
Phasor’s Chart
- View the phasor’s amplitude and angle for a selected time range
- Set the zero alignment
- Set boundaries
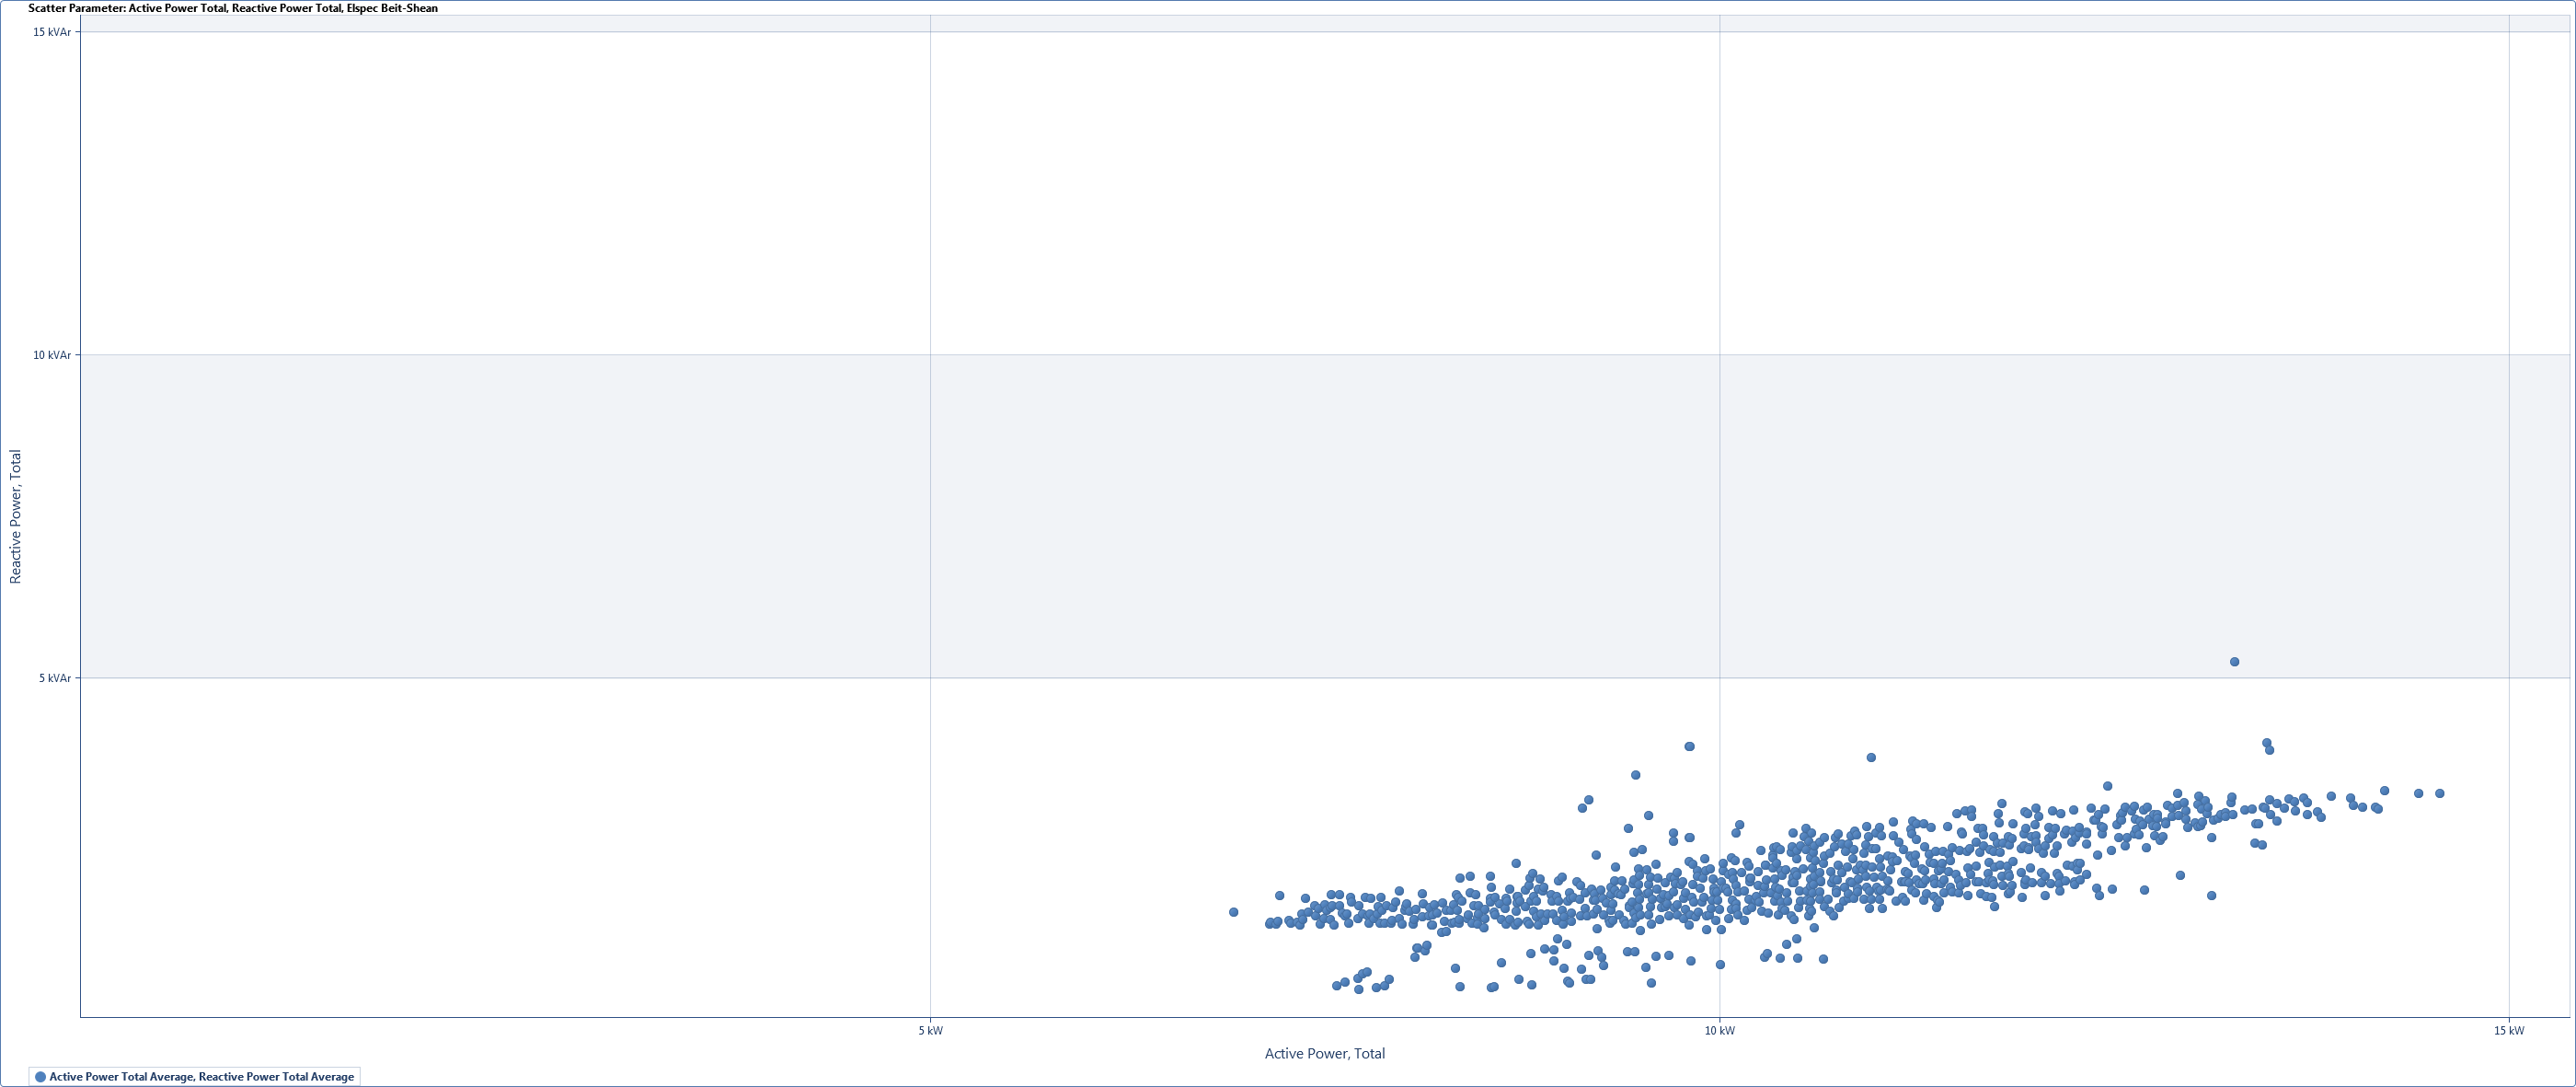
Scatter Parameters Chart
View scattered dots of a specific parameter in relation to another parameter
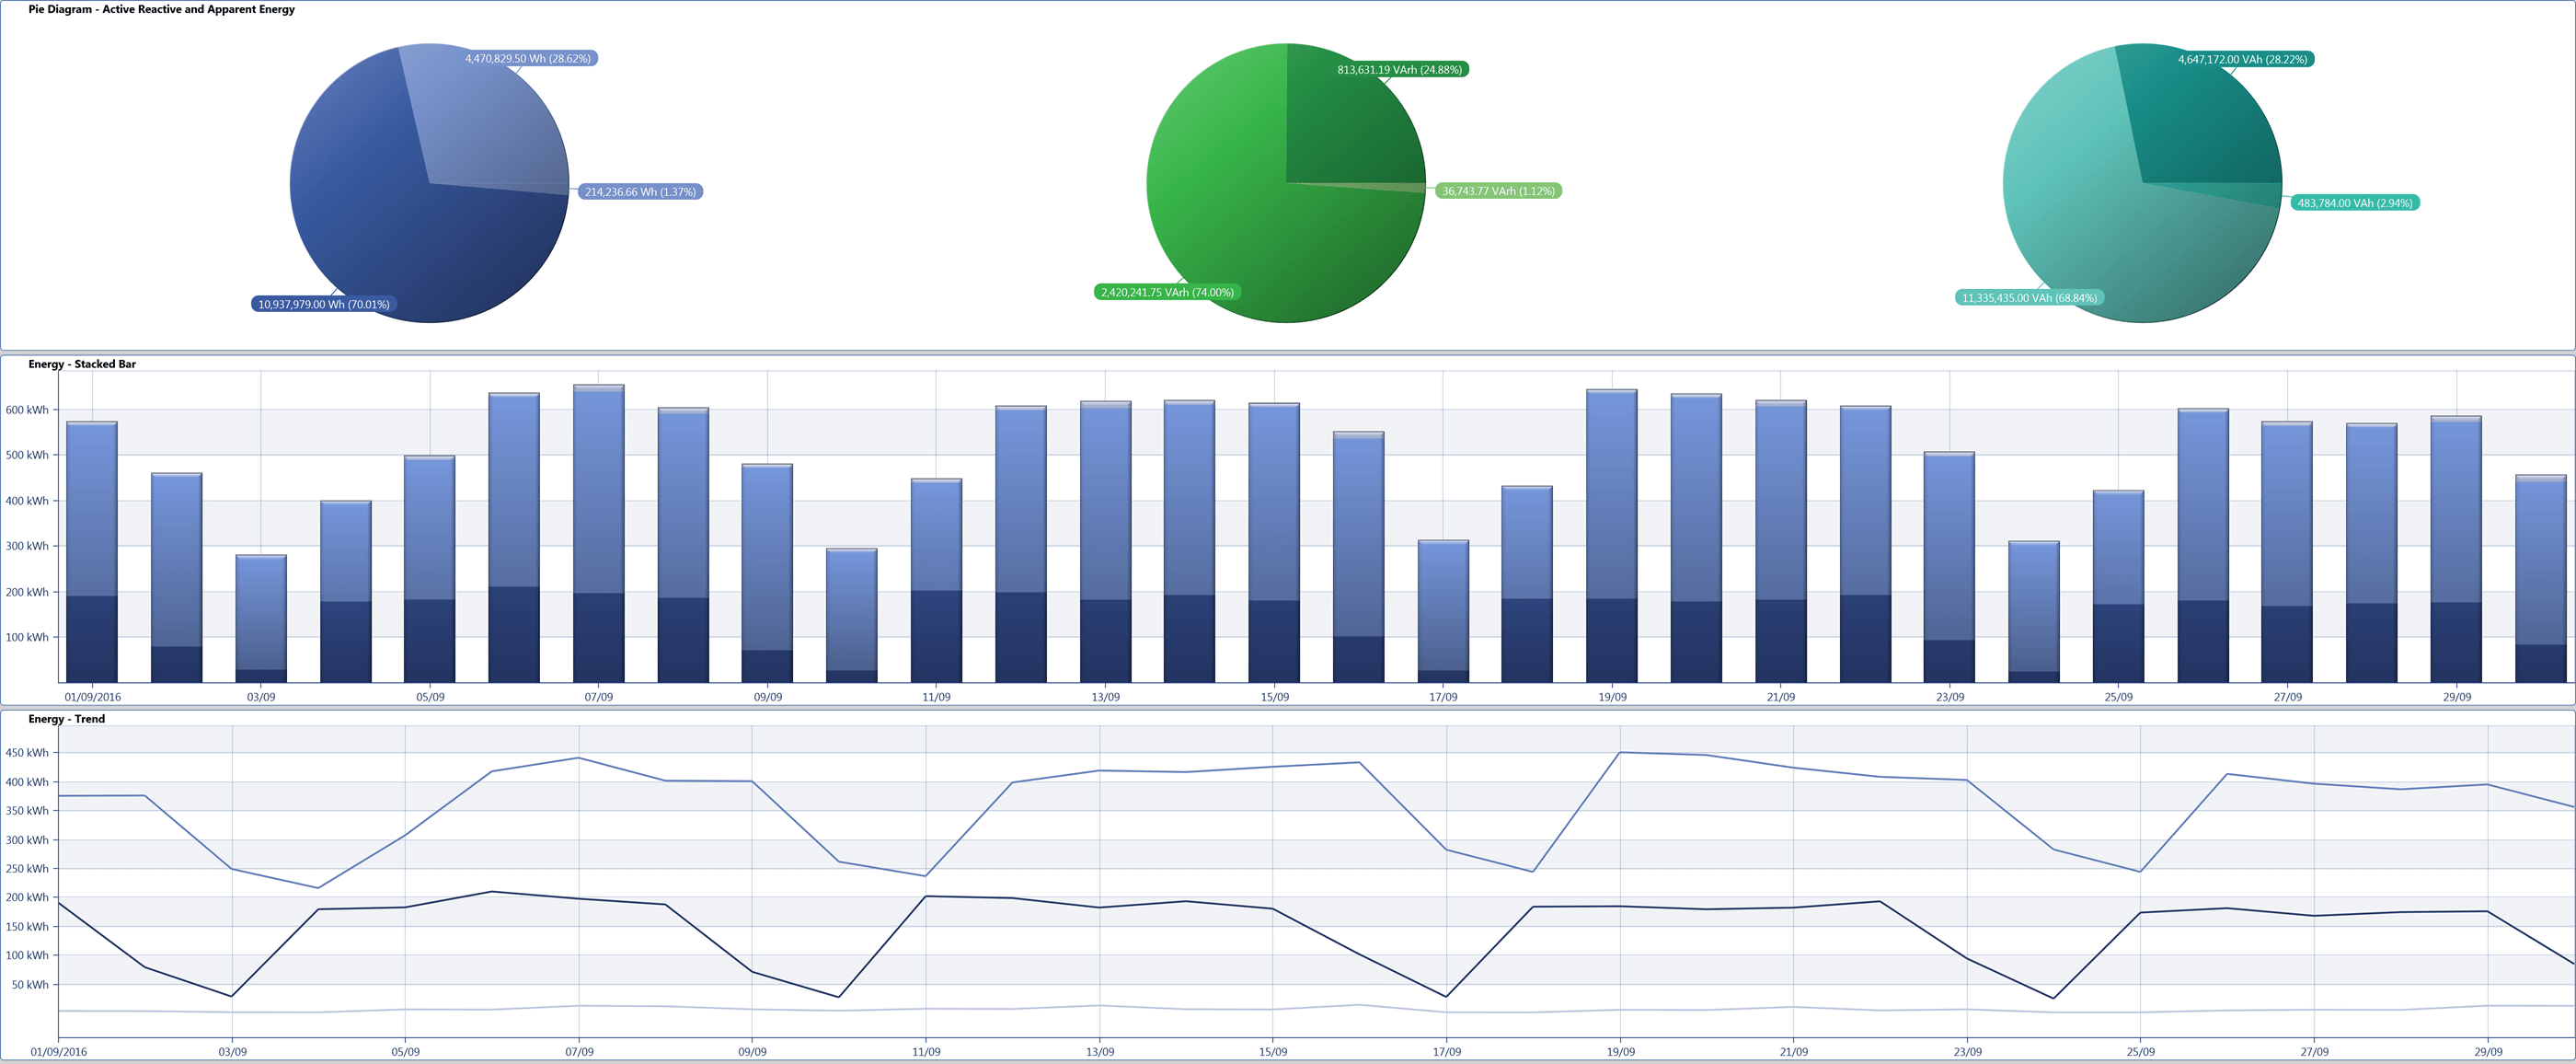
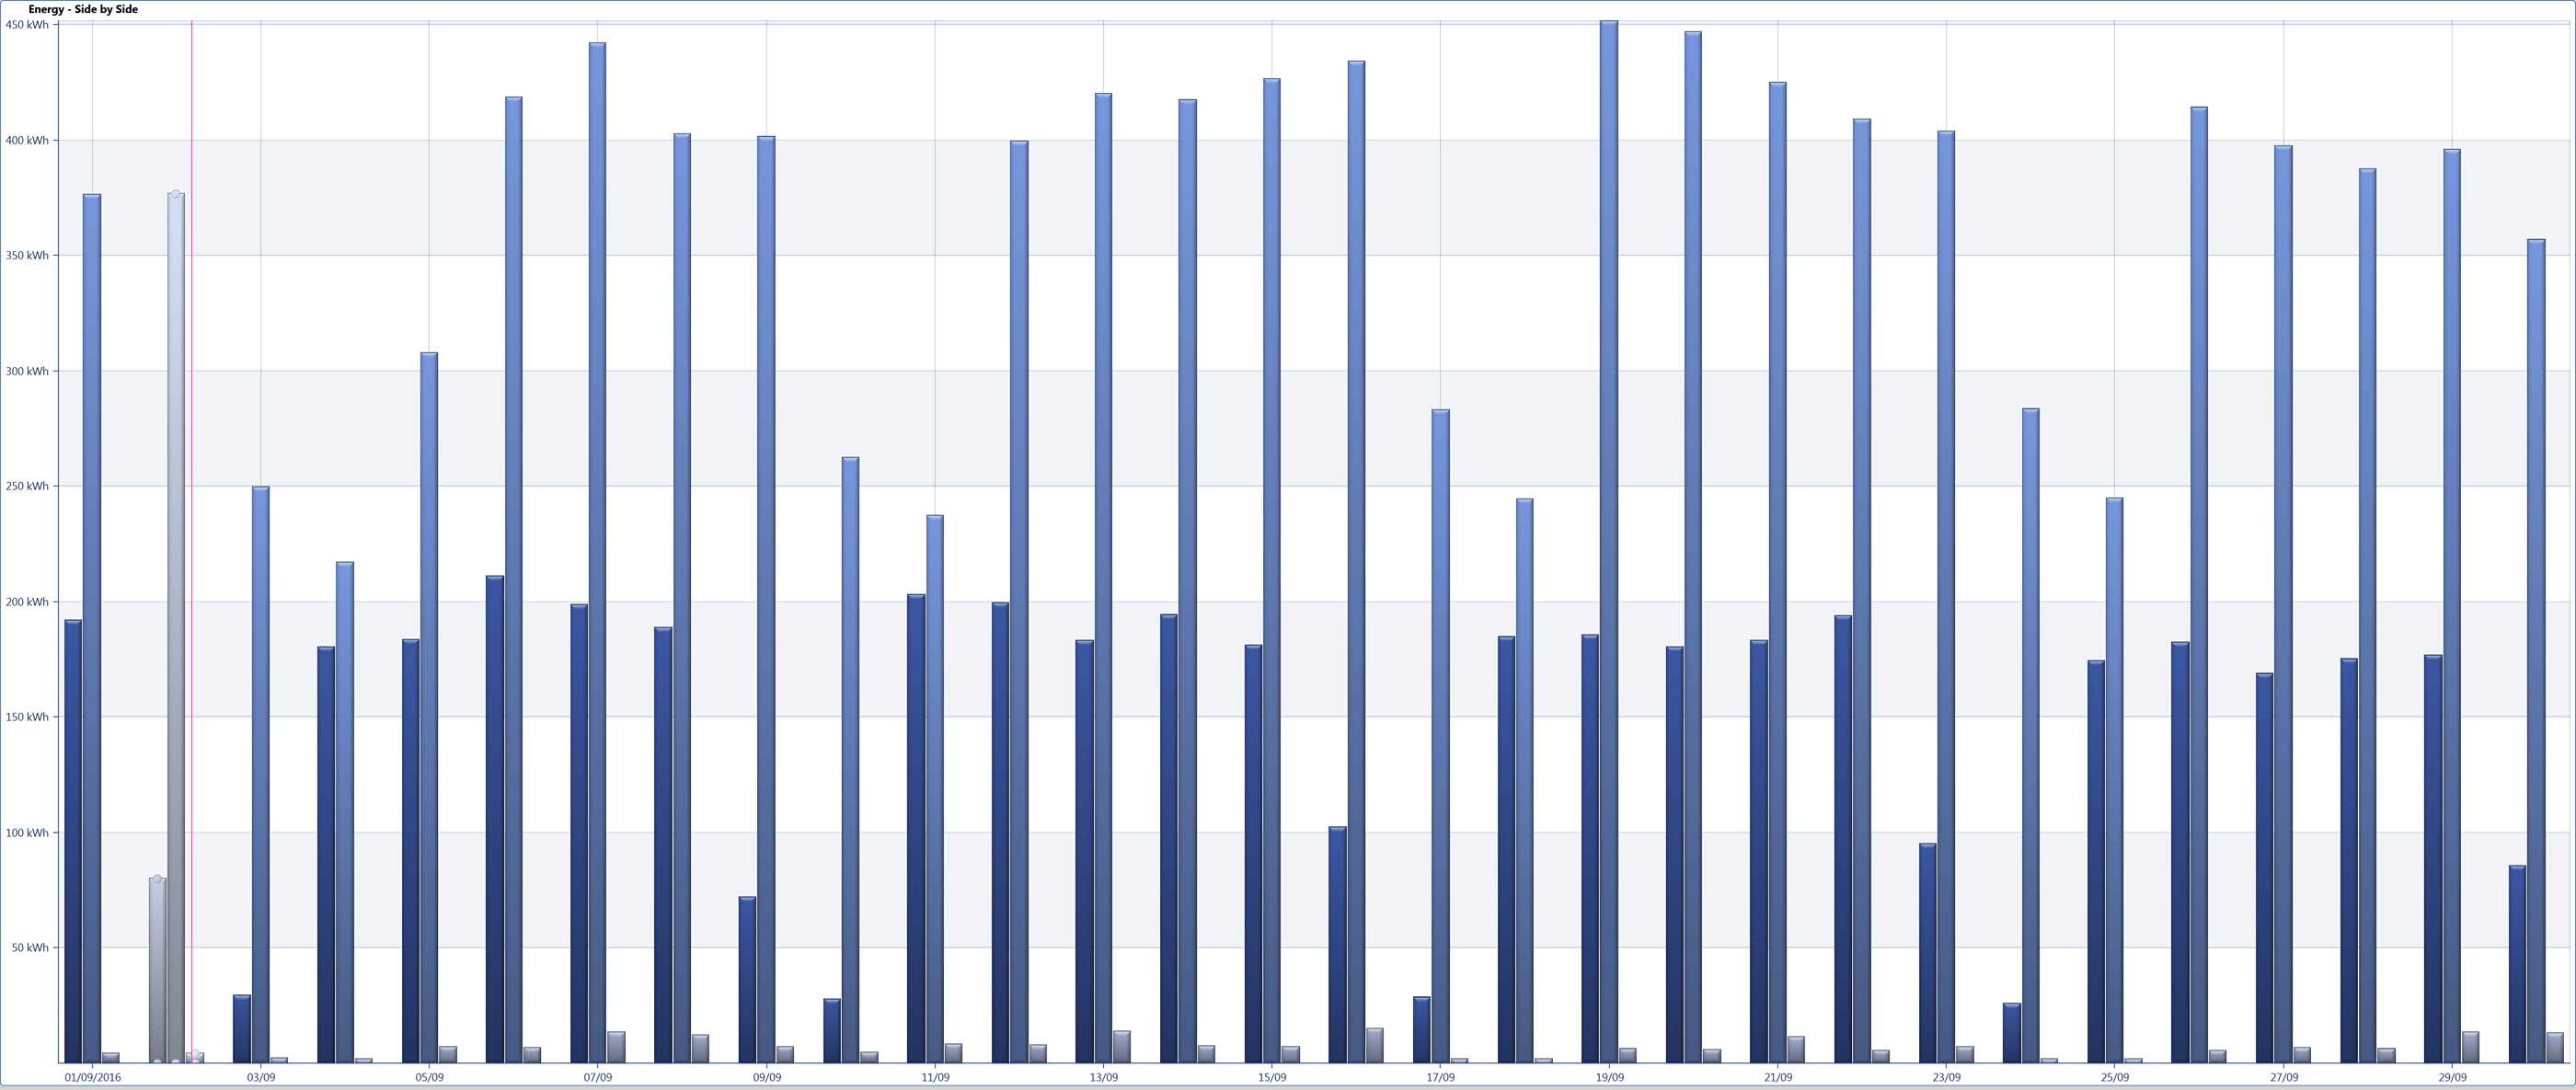
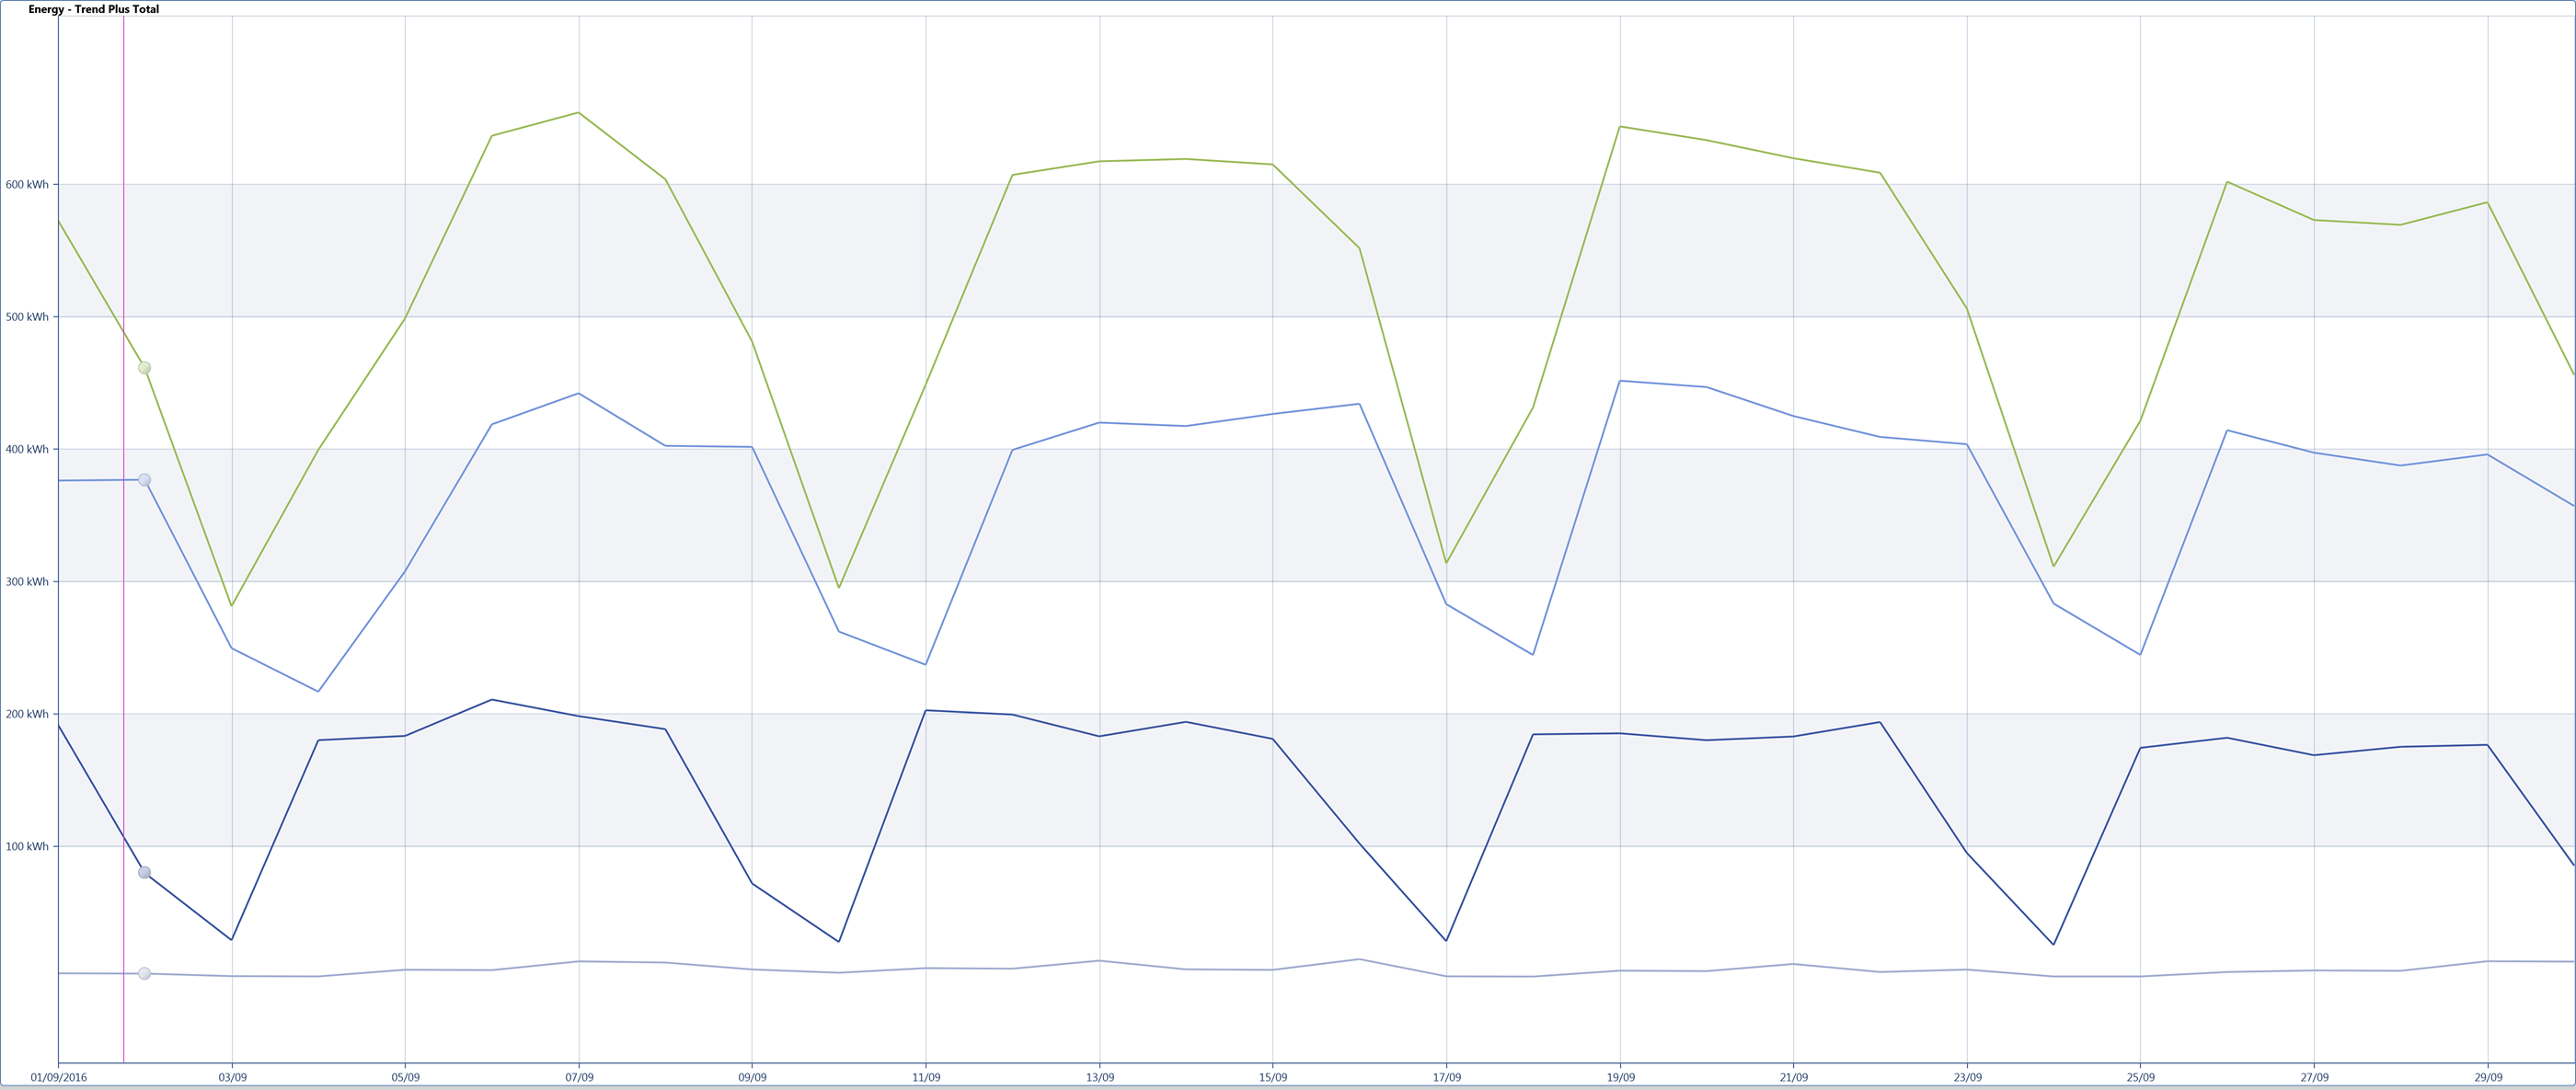
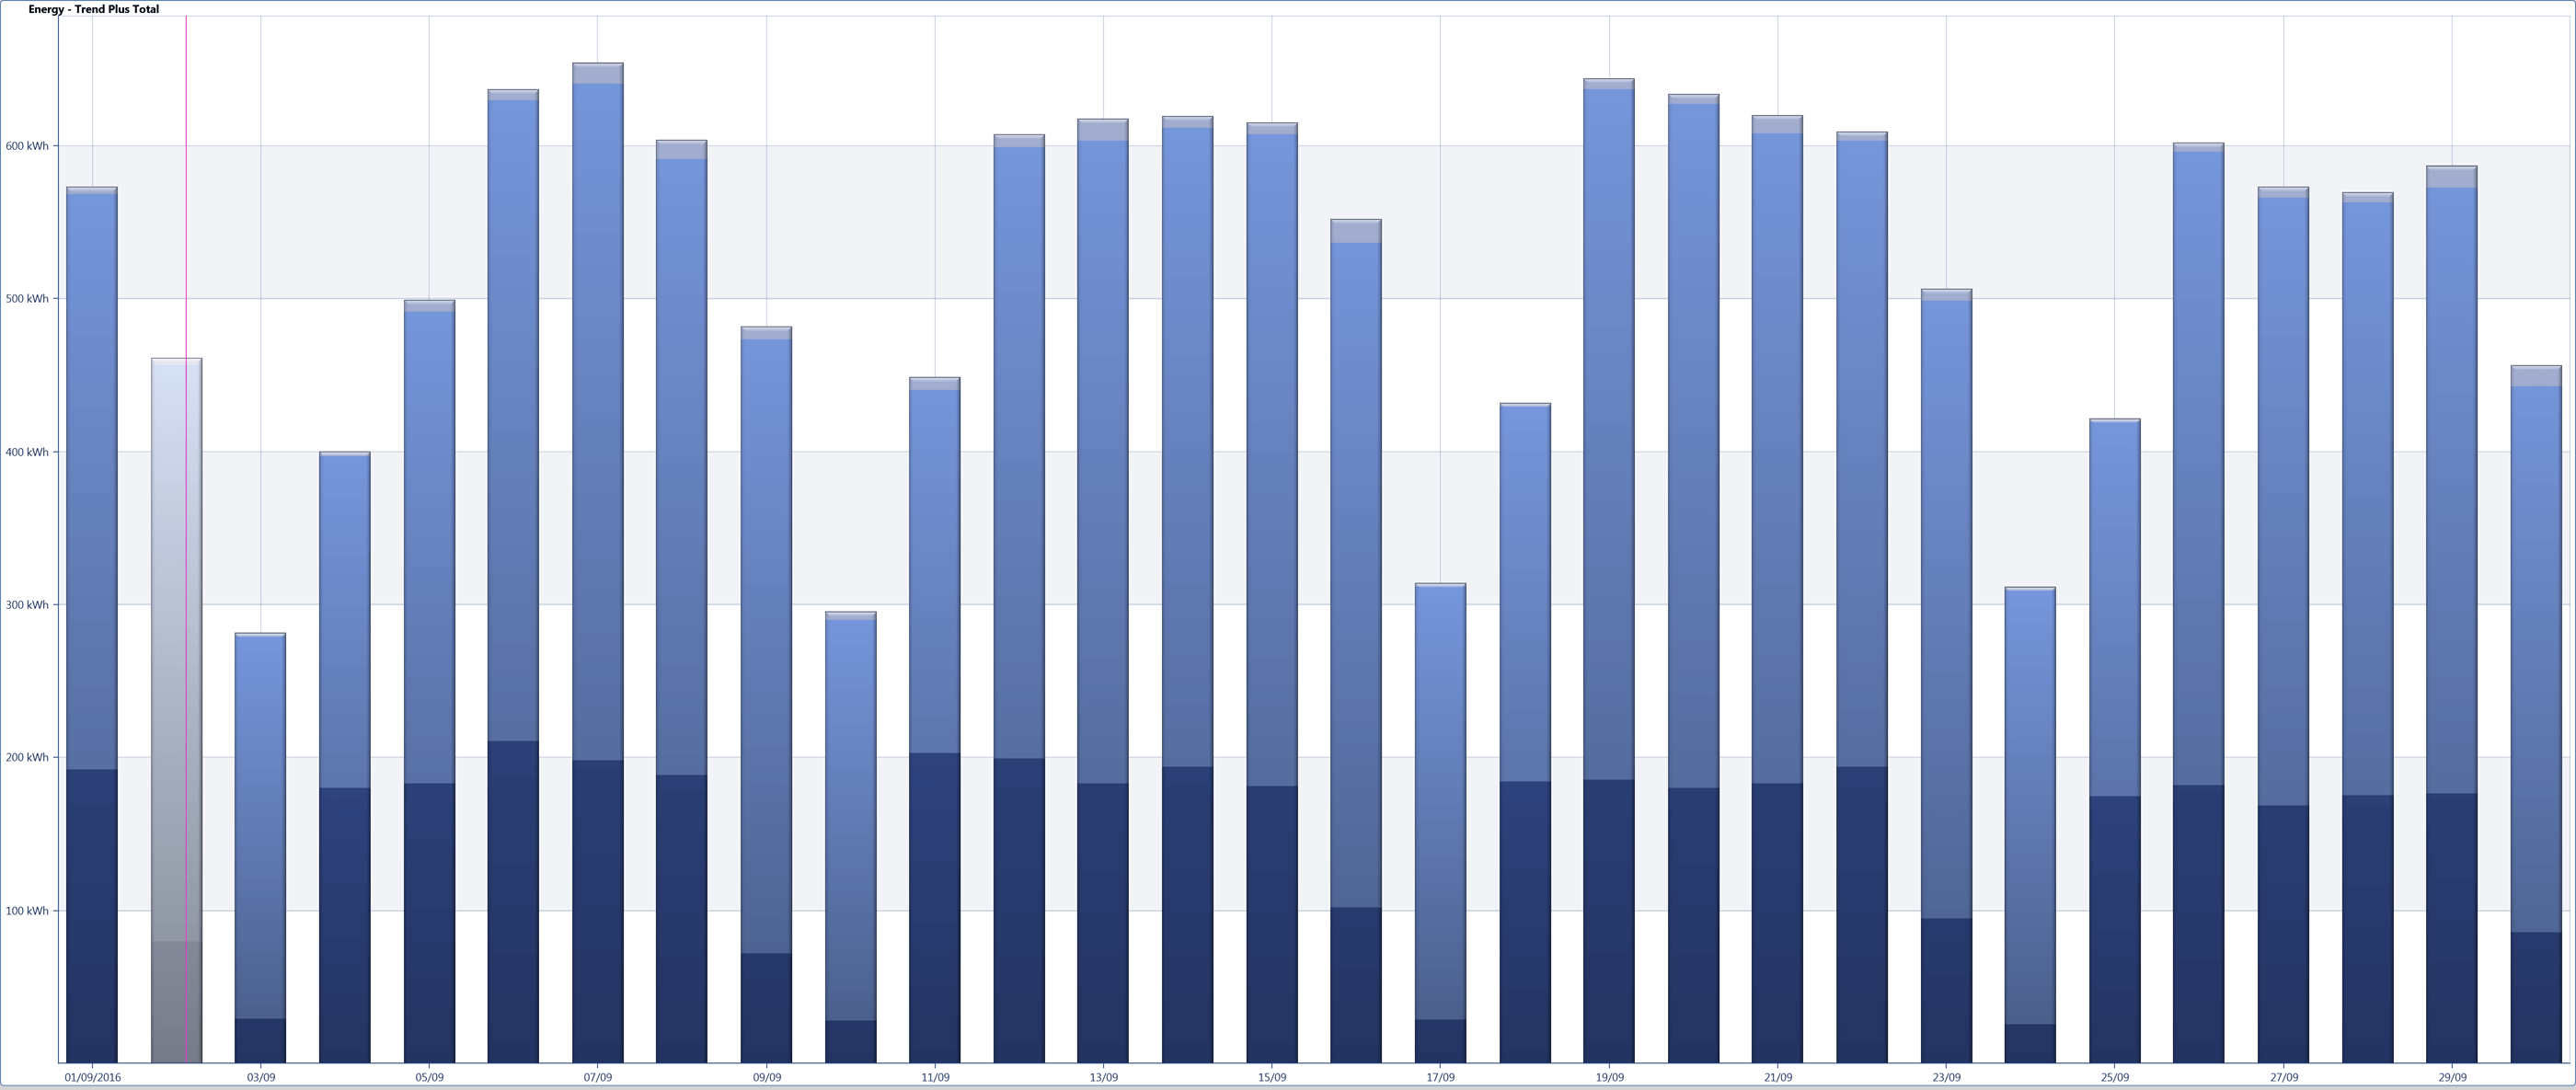
Energy Charts
- View Energy data of multiple points for selected time frame
- Stacked bar
- Side by Side bars
- Pie chart
- Trend over time with total series
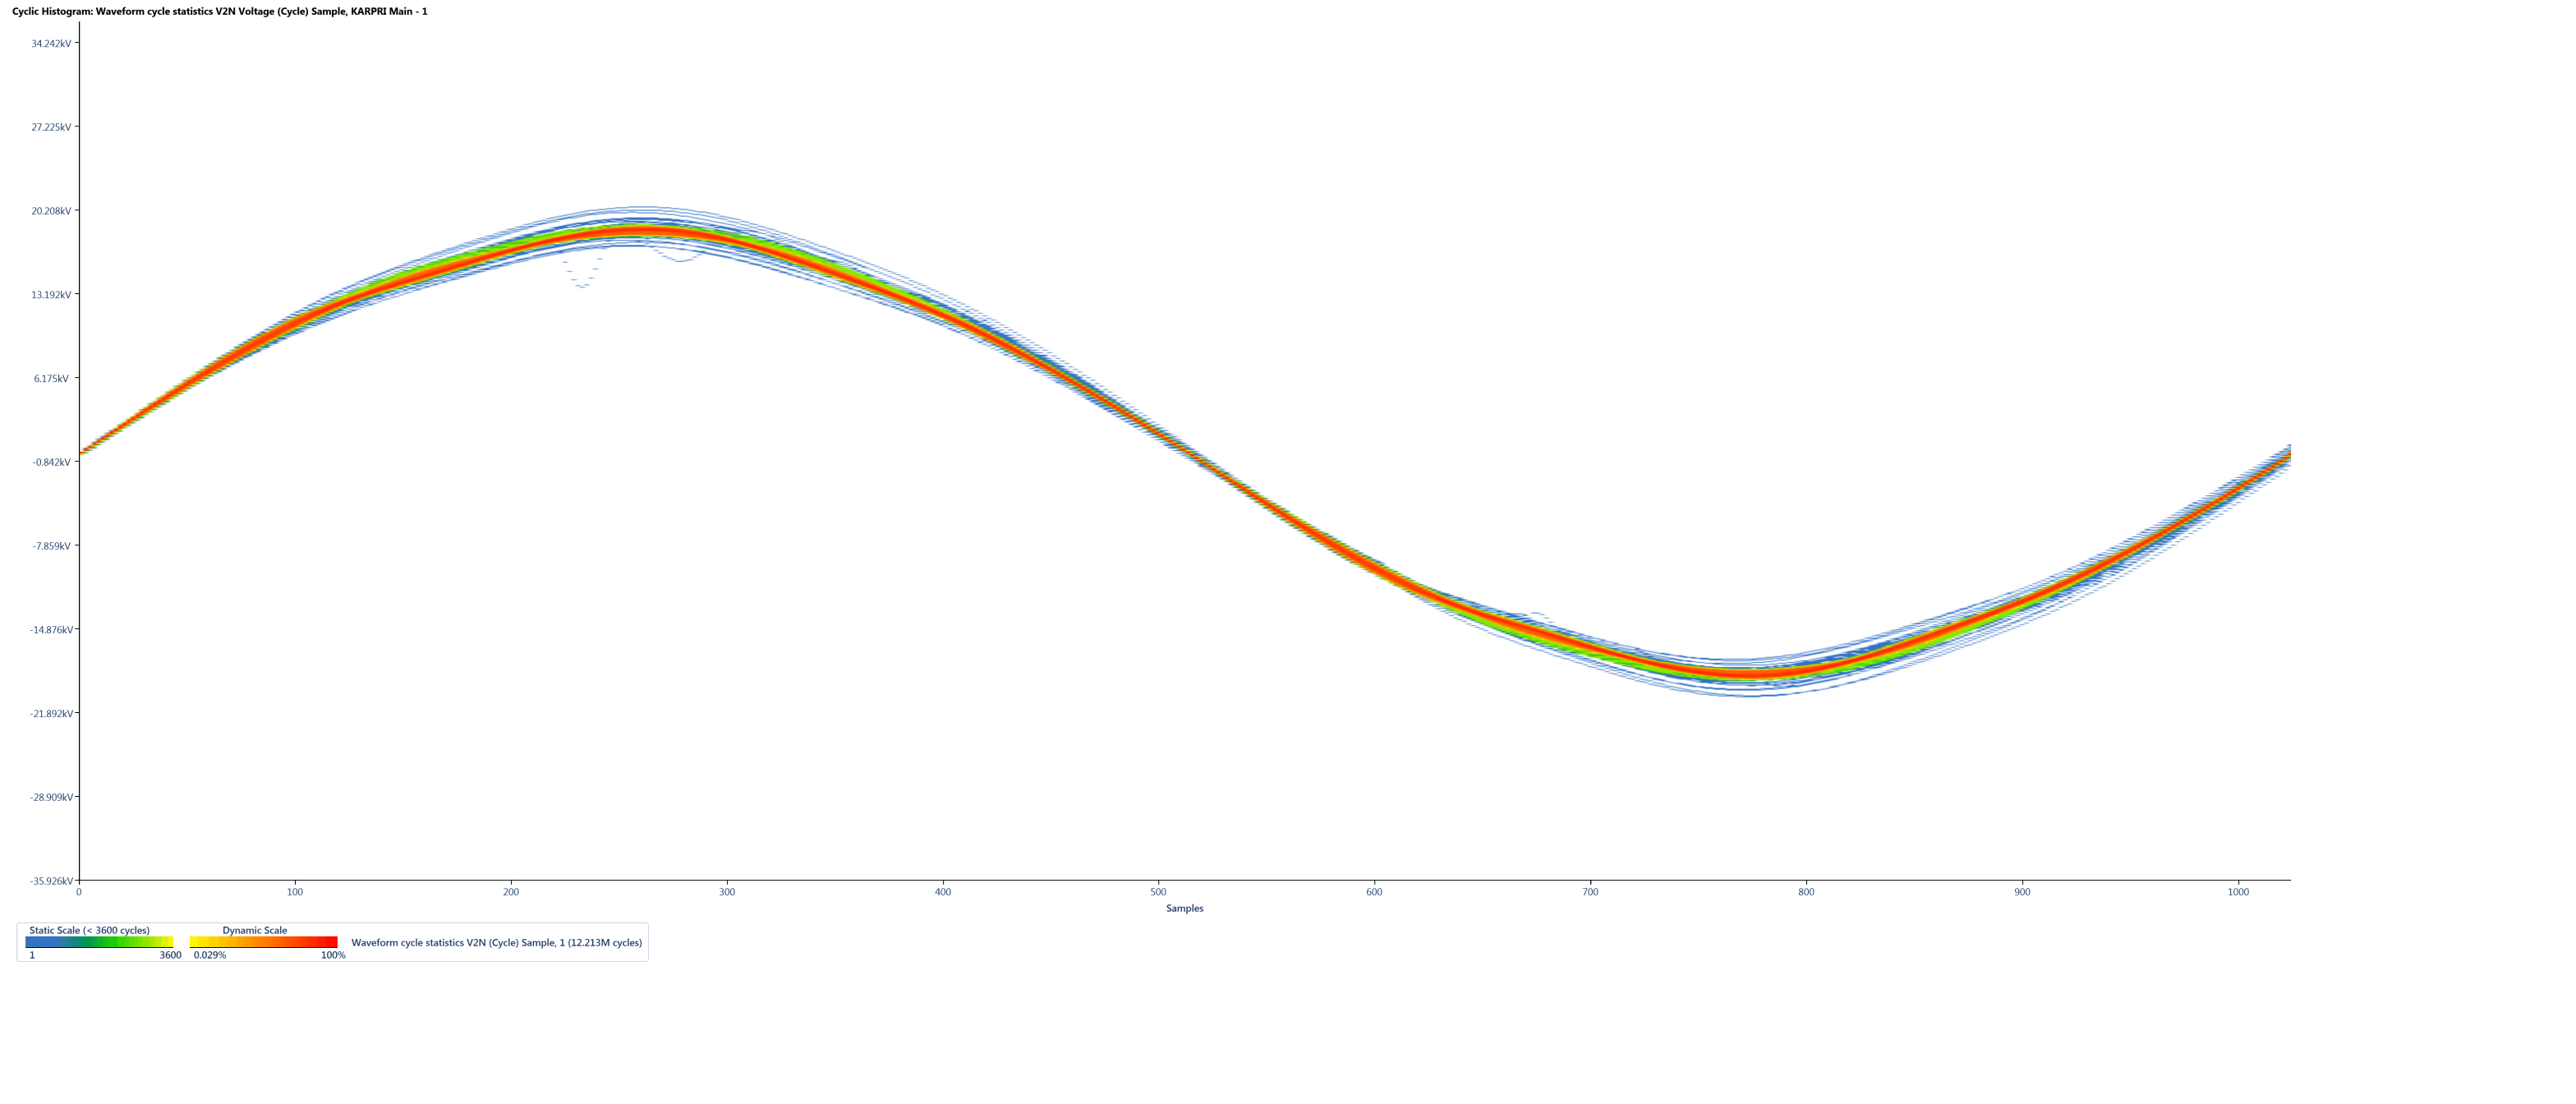
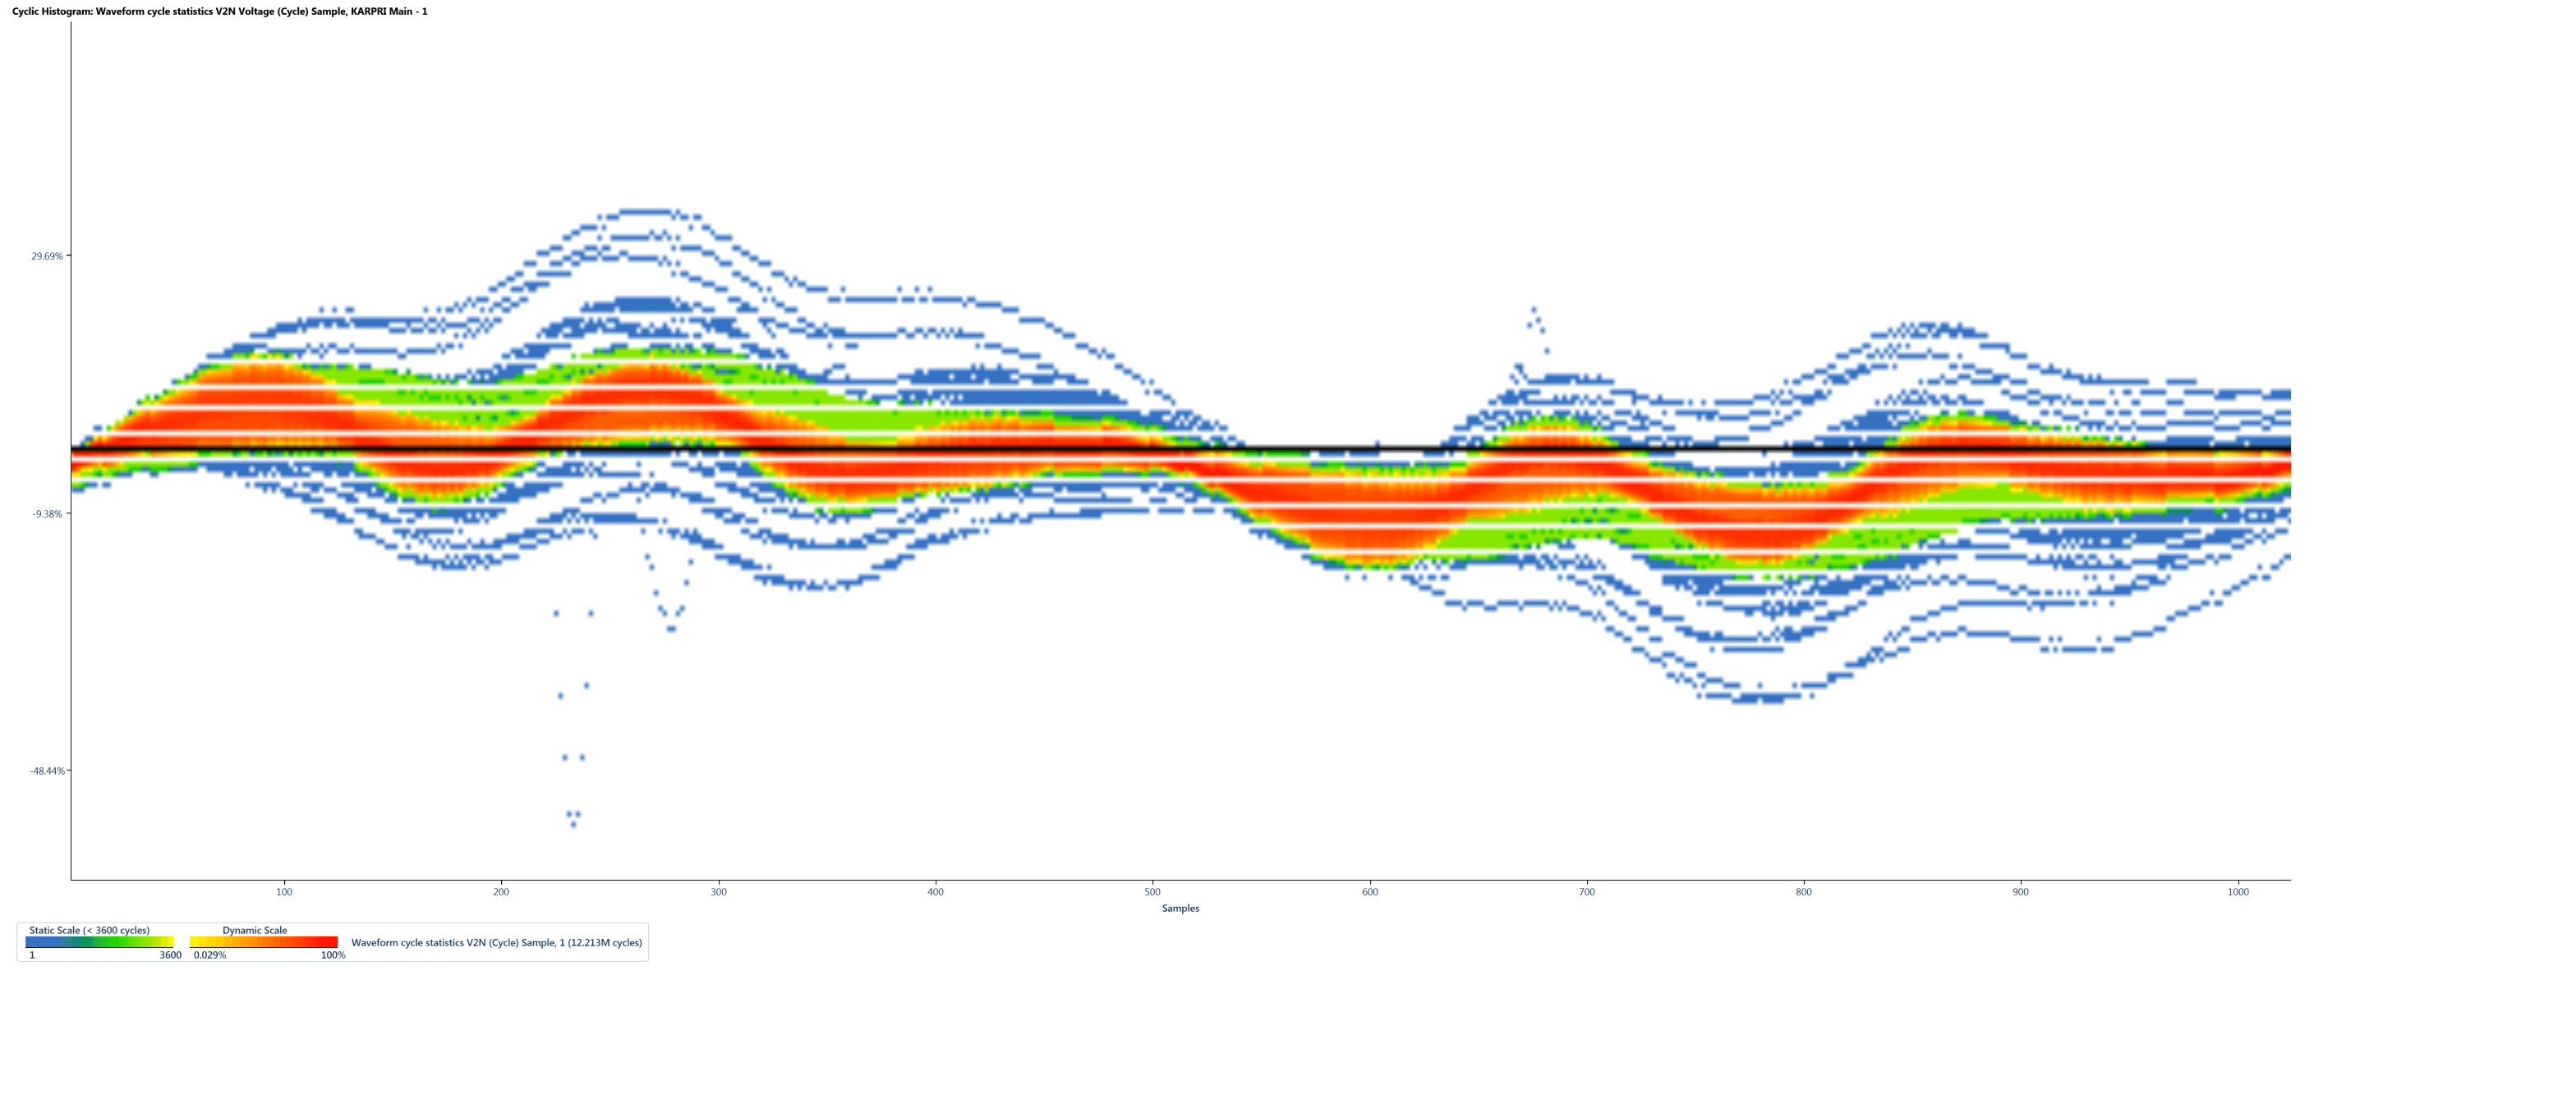
Cyclic Histogram
The X and Y axes make up a given number of bins for Z values to be established. As a given X sample is selected, the Y value is measured and placed in the corresponding bin as a percent, which is derived from one sample divided by total samples in the T measurement period. If one or more values already exists in this bin, the percent value is mathematically added to the previous value(s). The number of bins is determined by horizontal and vertical resolution.